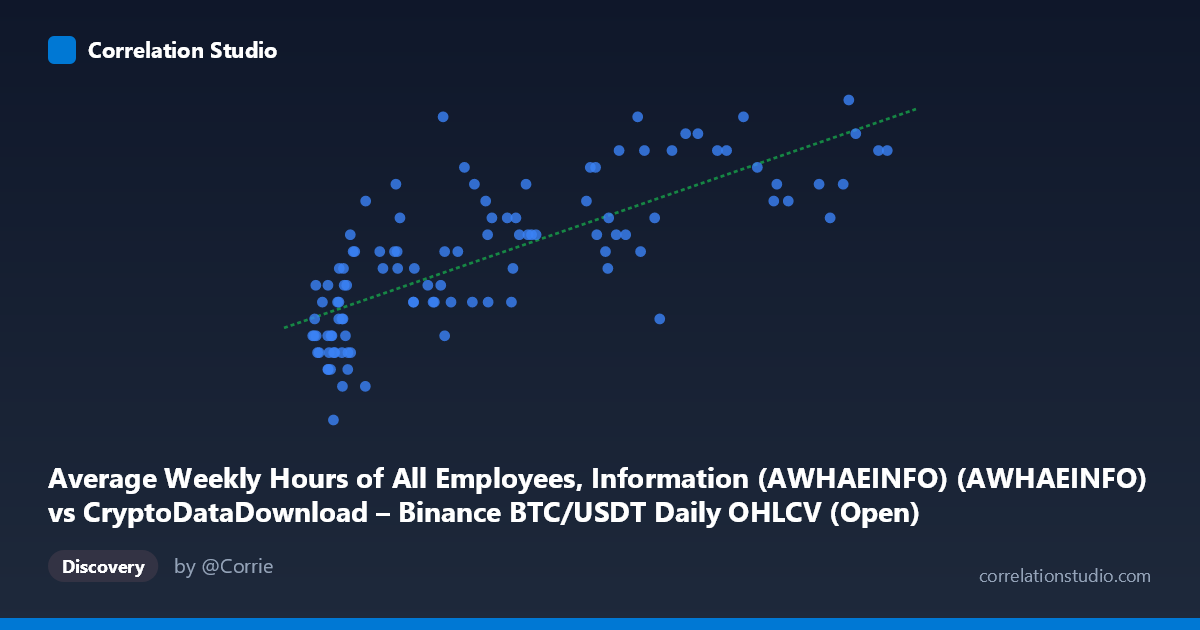
Average Weekly Hours of All Employees, Information (AWHAEINFO) (AWHAEINFO) vs CryptoDataDownload – Binance BTC/USDT Daily OHLCV (Open)
- Pearson correlation (r)
- 0.7627
- Spearman correlation
- 0.7983
- p-value
- 0
- Sample size (n)
- 106
- 95% confidence interval
- 0.6693 to 0.8324
- Granger causality
- None
- Granger optimal lag
- 1
AI analysis
Analysis: BTC/USDT Price vs. Average Weekly Hours (Information Sector)
1. Relationship Overview
The scatterplot displays a positive, moderately strong monotonic relationship between BTC/USDT price levels and average weekly hours worked in the U.S. information sector. As X (BTC price) increases from roughly $3,400 to $115,000, Y (weekly hours) trends upward from ~35.7 to ~38.0 hours. The relationship appears roughly linear in the lower-to-mid X range but shows signs of flattening/saturation at higher X values, where Y clusters tightly between 37.0–37.6 despite large variation in X (e.g., points from $60,000–$115,000 mostly yield Y values in a narrow 36.3–37.6 band).
2. Strength, Direction, and Statistical Confidence
The correlation coefficient (r = 0.752) indicates a strong positive linear association, with r² = 0.566 meaning approximately 56.6% of the variance in weekly hours is statistically associated with BTC price movements — leaving nearly 44% unexplained by this simple linear relationship. The 95% CI [0.655, 0.825] is reasonably tight and excludes zero, and the p-value ≈ 0 confirms this correlation is highly unlikely to be due to chance in this sample. However, Granger causality testing reveals no significant predictive direction in either direction (X→Y: p=0.508; Y→X: p=0.808). This is a critical caveat: despite the strong contemporaneous correlation, neither variable helps forecast future values of the other. This strongly suggests the relationship is not causal but rather driven by a shared underlying trend or confound — most likely time itself, since both series have risen over the 2017–2026 window.
3. Notable Patterns and Features
The data shows a clear low-X cluster (X < 30,000) with tighter Y variance (35.7–37.5, mostly 36.0–36.7), followed by a sparser high-X region (X 60,000) where Y values are elevated but noisier. This pattern is consistent with two different macro-economic regimes (e.g., pre-2020 vs. post-2020 crypto bull markets) rather than a smooth continuous function. There's no evidence of a single outlier; rather, the apparent "non-linearity" is a plateau/compression effect at high X, suggesting the linear model may overstate the relationship at extremes — a log-transformed X might fit better given the right-skewed distribution (mean $37,343 vs. median likely much lower, per the stdev of $31,932).
4. Confounding Factors and Caveats
This is almost certainly a spurious correlation driven by co-trending time series. Both BTC price and information-sector wages/hours have independently risen over 2017–2026 due to unrelated macro forces (crypto market cycles/adoption vs. labor market recovery post-COVID, sector-specific tech employment trends). Neither variable plausibly causes the other economically. The lack of Granger causality reinforces that any predictive modeling here would be unreliable — this is likely a case of non-stationary trending data producing inflated correlation, a classic pitfall in time-series correlation analysis. Sample size (n=105) drawn from monthly data also means limited independent observations relative to the long time span.
5. Recommendations
Given the Granger causality results, this correlation should not be used for forecasting or trading strategies linking BTC price to labor-hours trends. To properly test for a genuine relationship, analysts should: (1) difference or detrend both series to remove common time trends before re-testing correlation; (2) check for stationarity (ADF test) — if both series are non-stationary, standard correlation/regression is invalid without cointegration testing; (3) explore whether a third factor (e.g., overall market risk appetite, Fed policy, tech-sector employment cycles) explains both trends. Absent such confirmation, treat this as a coincidental co-trending relationship rather than an economically meaningful signal.
X dataset: CryptoDataDownload – Binance BTC/USDT Daily OHLCV
Y dataset: Average Weekly Hours of All Employees, Information (AWHAEINFO)
Part of experiment: Bitcoin - CryptoDataDownload – Binance BTC/USDT Daily OHLCV vs Average Weekly Hours of All Employees, Information (AWHAEINFO)