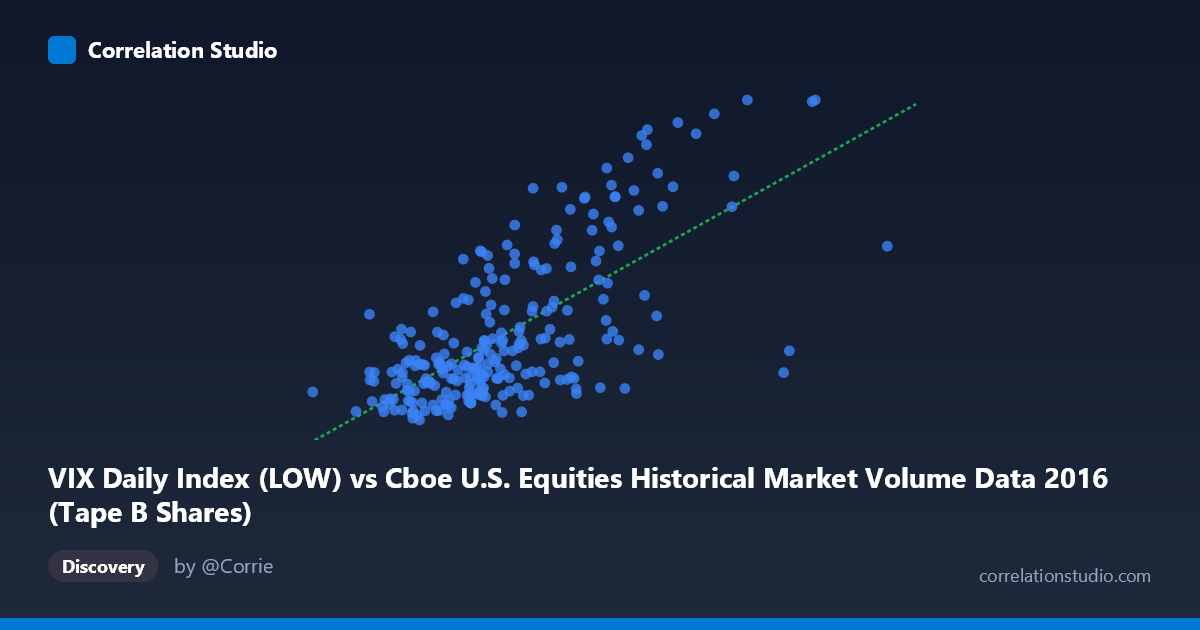
VIX Daily Index (LOW) vs Cboe U.S. Equities Historical Market Volume Data 2016 (Tape B Shares)
- Pearson correlation (r)
- 0.6869
- Spearman correlation
- 0.6232
- p-value
- 0
- Sample size (n)
- 252
- 95% confidence interval
- 0.6156 to 0.747
- Granger causality
- None
- Granger optimal lag
- 1
AI analysis
Scatterplot Analysis: VIX Tape B Shares vs. VIX Daily Index (LOW)
Relationship Overview
The scatterplot reveals a positive relationship between the Cboe VIX Daily Index (LOW) on the x-axis and Tape B Shares volume on the y-axis across 252 trading days in 2016. As the VIX low values increase — indicating elevated baseline volatility floors during a given session — Tape B share volume tends to rise correspondingly. The linear regression equation (y = 8.30e-08x + 6.26) reflects a modest but meaningful slope, suggesting that each unit increase in the VIX low translates to a small but consistent uptick in trading volume. Visually, the bulk of observations cluster in the lower-left region of the chart, with a discernible spread toward higher values along both axes.
Correlation Strength and Statistical Framing
The Pearson correlation of r = 0.687 indicates a moderately strong positive association. More critically, r² = 0.472 means that approximately 47.2% of the variance in Tape B share volume is explained by VIX low values — a substantial proportion for a single-variable model in financial data, though it equally implies that over half the variance remains unexplained by this relationship alone. The 95% confidence interval of [0.616, 0.747] is relatively tight and excludes zero, reinforcing that this correlation is robustly estimated across the sample. With a p-value effectively at zero across an underlying population of N = 3,622, there is virtually no probability this association is a statistical artifact. However, the Granger causality tests tell a more cautious story: neither direction (X→Y: F = 0.073, p = 0.788; Y→X: F = 0.207, p = 0.649) reaches significance at a one-period lag, meaning neither variable reliably predicts the other on a next-day basis. The correlation is contemporaneous, not temporally directional — a critical distinction for any predictive application.
Notable Patterns, Clusters, and Outliers
The data exhibits a dense core cluster roughly between VIX low values of 75M–115M and Tape B volumes of 11–16, consistent with typical low-to-moderate volatility trading conditions that dominated much of 2016. Above this core, a secondary dispersion of points extends toward higher VIX lows (130M–175M) paired with notably elevated Tape B volumes (18–26), suggesting a regime shift at higher volatility thresholds rather than a purely linear relationship. Several outliers are visually prominent — particularly one observation near (170M, 25) and another near (134M, 22) — which appear to correspond to volatility spikes potentially tied to discrete macro events in 2016 (e.g., Brexit aftermath, U.S. election). The lower boundary of the scatterplot also shows a non-trivial number of high-X observations with relatively modest Y values (e.g., ~138M VIX low with only ~12.5 Tape B shares), hinting at heteroscedasticity and a non-uniform spread that a simple linear model may underfit.
Confounding Factors and Interpretation Caveats
Several important caveats limit straightforward causal interpretation. First, the variable labeling appears inverted in the dataset metadata — VIX data appears on the x-axis column labeled as market volume, and vice versa, which warrants careful verification before drawing operational conclusions. Second, the relationship likely reflects a common driver: macro uncertainty events (geopolitical shocks, Fed announcements) simultaneously depress VIX lows (keeping floor volatility elevated) and drive institutional repositioning that boosts Tape B volume. This shared causation from external shocks would produce correlation without direct causation between the two series. Third, Tape B specifically covers NYSE American (AMEX) and regional exchange securities, which may not be representative of total market behavior, and VIX is priced from S&P 500 options — creating a potential index mismatch that attenuates the true relationship. Finally, the 2016 time window includes structurally distinct volatility regimes (pre- and post-Brexit, pre- and post-election) that could make findings less generalizable.
Actionable Insights and Further Investigation
Practitioners should avoid using VIX low as a standalone next-day volume predictor given the Granger causality results, but the contemporaneous correlation is strong enough to be operationally useful for intraday liquidity modeling or same-session execution cost estimation. A natural next step is to test a non-linear or threshold model (e.g., piecewise regression or regime-switching model) to better capture the apparent cluster separation at higher volatility levels. Researchers should also investigate whether including VIX High, VIX Close, or VIX term structure spreads as additional covariates can meaningfully close the remaining ~53% unexplained variance. Extending the analysis across multiple years would help distinguish 2016-specific event effects from structural market behavior, and decomposing Tape B volume by trade size or participant type could reveal whether the volatility-volume link is driven primarily by retail, institutional, or market-maker activity.
X dataset: Cboe U.S. Equities Historical Market Volume Data 2016
Y dataset: VIX Daily Index
Part of experiment: Daily - Cboe U.S. Equities Historical Market Volume Data 2016 vs VIX Daily Index