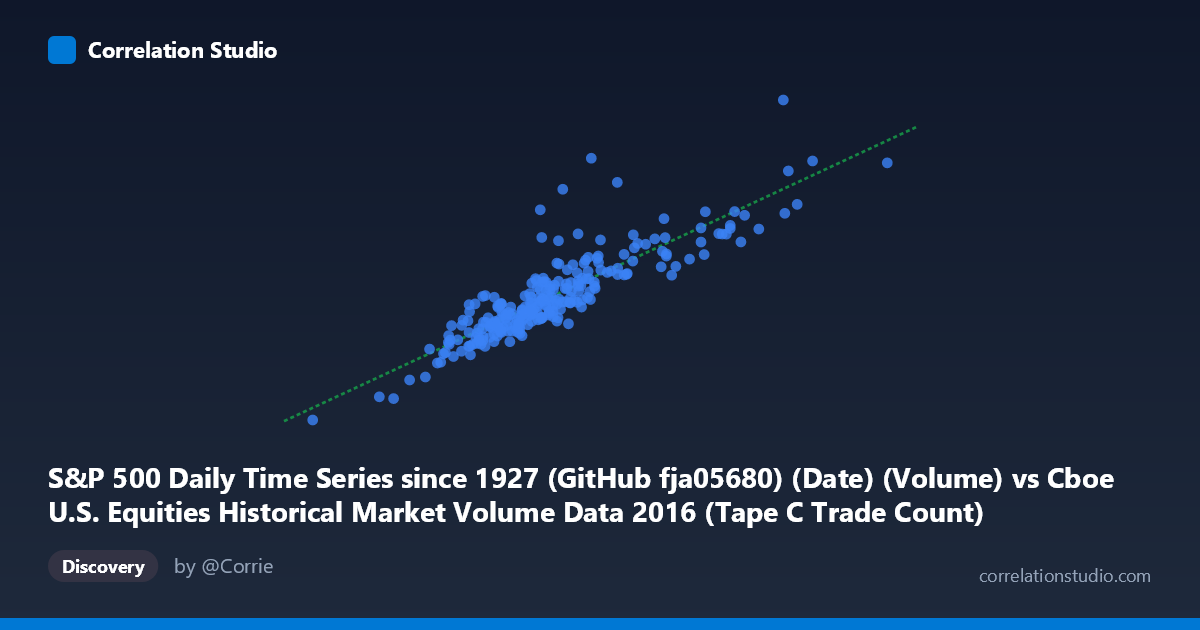
S&P 500 Daily Time Series since 1927 (GitHub fja05680) (Date) (Volume) vs Cboe U.S. Equities Historical Market Volume Data 2016 (Tape C Trade Count)
- Pearson correlation (r)
- 0.8732
- Spearman correlation
- 0.8826
- p-value
- 0
- Sample size (n)
- 252
- 95% confidence interval
- 0.8402 to 0.8997
- Granger causality
- None
- Granger optimal lag
- 10
AI analysis
Analysis: S&P 500 Daily Volume vs. Cboe Tape C Trade Count (2016)
Relationship Overview The scatterplot reveals a strong, positive linear relationship between the S&P 500 daily trading volume and the Cboe Tape C trade count across 252 trading days in 2016. As daily volume increases, the number of discrete trades on Tape C rises correspondingly, which is mechanically intuitive — higher volume days tend to reflect elevated market participation, manifesting both in share quantities exchanged and the raw number of individual transactions executed. The linear regression equation (y = 4803.69x + 4.785×10⁸) suggests that for every additional unit increase in daily volume, Tape C trade count increases by approximately 4,804 transactions, with a meaningful baseline intercept indicating a floor level of trade activity even at lower volume levels.
Correlation Strength and Statistical Significance The correlation is both strong and highly statistically significant, with r = 0.8732 and r² = 0.7624. This means that approximately 76.2% of the variance in Tape C trade counts is explained by daily S&P 500 volume — a substantial explanatory share, though ~24% of variance remains attributable to other factors. The 95% confidence interval for r is tight at [0.840, 0.900], indicating high precision in the estimate given the sample of 252 paired observations drawn from a population of 3,622. The p-value of effectively zero confirms this relationship is not a sampling artifact. However, the Granger causality results introduce an important caveat: neither direction of temporal predictive causality is statistically significant (X→Y: F=1.17, p=0.31; Y→X: F=1.09, p=0.37) at a 10-period optimal lag. This means that while the two variables are strongly correlated contemporaneously, past values of one do not significantly predict future values of the other, ruling out a straightforward lead-lag trading signal.
Patterns, Clusters, and Outliers The data cloud is broadly linear and moderately tight across the mid-range, but several notable features emerge. The bulk of observations cluster in the volume range of roughly 580,000–800,000 with trade counts between ~3.0B and ~4.5B, forming a dense central band. There are visible high-leverage points in the upper right — notably observations near volume ~1,023,000 (trade count ~5.08B) and ~990,000 (~4.69B) — that appear to be high-activity outlier days, likely corresponding to volatility events or index rebalancing periods. On the lower end, points around volume ~504,000–520,000 with trade counts near 2.65B–2.85B represent unusually quiet sessions. A few points also show vertical scatter — for example, observations near x~587,000 showing both ~3.08B and ~3.91B trade counts — suggesting that identical volume levels can yield materially different trade counts, implying variation in average trade size.
Confounding Factors and Caveats Several important caveats apply. First, the axis labeling in the provided metadata appears to contain a dataset join artifact: the X-axis references "Volume" from an S&P 500 time series dataset, while the Y-axis references "Tape C Trade Count" from the Cboe dataset — both are market activity metrics and their correlation may partly reflect that they are co-driven by the same underlying market conditions (e.g., volatility spikes, macro announcements, options expiration dates) rather than a direct causal mechanism between them. Second, Tape C specifically covers NYSE Arca-listed securities (predominantly ETFs), so the relationship may be amplified on days when ETF arbitrage activity surges alongside broad index volume. Third, secular intraday and day-of-week patterns, as well as known anomalies like quarterly expiration "quad witching" days, could be responsible for some of the high-end outliers without representing regime changes.
Actionable Insights and Further Investigation Despite the lack of Granger causality, the contemporaneous correlation is strong enough to be practically useful for real-time market microstructure monitoring — anomalous divergences between volume and trade count could flag unusual average trade size dynamics (e.g., algorithmic fragmentation or block trading shifts). Further investigation should: (1) decompose residuals to identify which dates correspond to the high outliers and test whether they share a common catalyst; (2) stratify by day-of-week or monthly expiration cycle to isolate calendar effects; (3) include VIX or realized volatility as a third variable to test whether it mediates the correlation, potentially explaining the residual 24% variance; and (4) test non-linear specifications (e.g., log-log regression) since volume-count relationships in market microstructure often follow power-law dynamics rather than strict linearity.
X dataset: Cboe U.S. Equities Historical Market Volume Data 2016
Y dataset: S&P 500 Daily Time Series since 1927 (GitHub fja05680) (Date)
Part of experiment: Daily - Cboe U.S. Equities Historical Market Volume Data 2016 vs S&P 500 Daily Time Series since 1927 (GitHub fja05680) (Date)