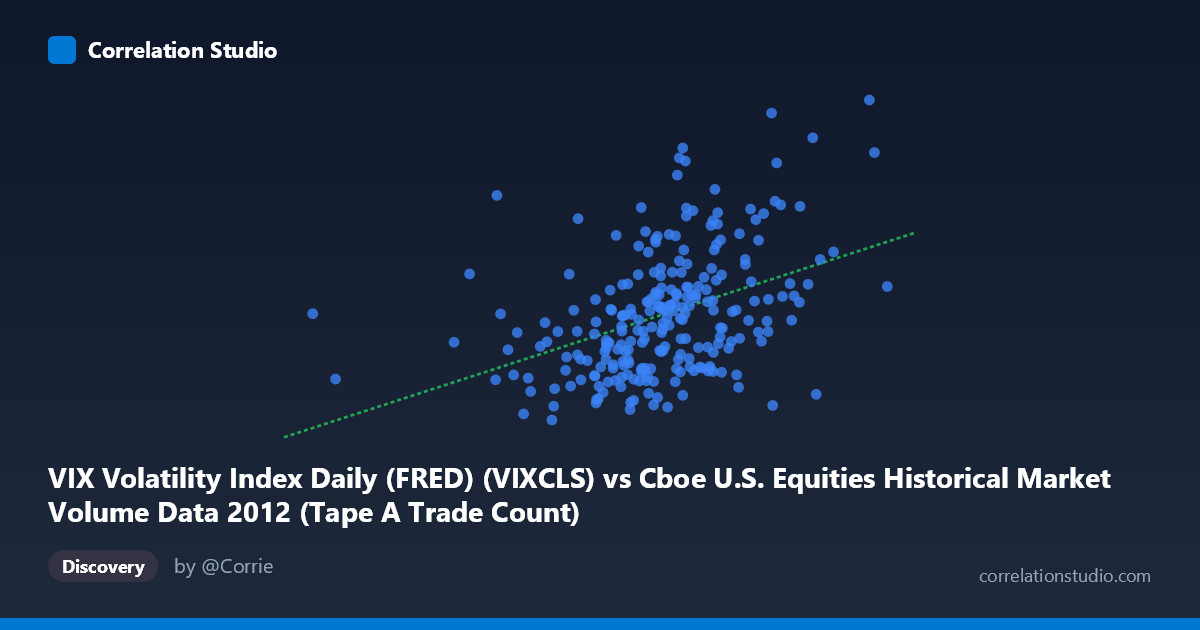
VIX Volatility Index Daily (FRED) (VIXCLS) vs Cboe U.S. Equities Historical Market Volume Data 2012 (Tape A Trade Count)
- Pearson correlation (r)
- 0.4096
- Spearman correlation
- 0.4339
- p-value
- 0
- Sample size (n)
- 250
- 95% confidence interval
- 0.3008 to 0.5079
- Granger causality
- None
- Granger optimal lag
- 1
AI analysis
Analysis: VIX Volatility Index vs. Cboe Tape A Trade Count (2012)
Relationship Overview The scatterplot reveals a moderate positive relationship between the VIX Volatility Index and Tape A Trade Count across U.S. equity exchanges in 2012. As market volatility increases, trading activity (measured by trade count) tends to rise alongside it — a relationship that aligns intuitively with market microstructure theory: heightened uncertainty drives participants to rebalance portfolios, hedge positions, and react to price signals, collectively inflating transaction volumes. The linear regression equation (y = 7.17×10⁻⁶x + 10.61) confirms this upward slope, though the substantial scatter around the regression line signals that the relationship is far from deterministic.
Correlation Strength and Statistical Significance The Pearson correlation of r = 0.41 indicates a moderate positive association, but the coefficient of determination (r² = 0.168) is the more sobering metric: only ~16.8% of the variance in Tape A Trade Count is explained by VIX levels. The remaining ~83% is attributable to other factors entirely. That said, the result is statistically robust — the p-value of 1.56×10⁻¹¹ is extraordinarily small, and the 95% confidence interval [0.30, 0.51] is comfortably above zero and does not include it, confirming the correlation is not a sampling artifact across the n=250 paired observations drawn from N=3,750. However, the Granger causality tests return no significant predictive directionality in either direction (X→Y: F=0.077, p=0.782; Y→X: F=0.338, p=0.562). This is a critical caveat: despite a statistically significant contemporaneous correlation, VIX values do not reliably predict next-period trade counts, nor does trade count predict next-period VIX — the relationship is concurrent but not temporally predictive at a one-period lag.
Notable Patterns, Clusters, and Outliers Several structural features stand out in the point cloud. There is a dense cluster concentrated in the VIX range of roughly 850,000–1,150,000 (X-axis) and trade counts between approximately 15–20 (Y-axis), reflecting the majority of "ordinary" 2012 trading days when markets were relatively calm following the European debt crisis resolution attempts. Above a VIX of approximately 1,000,000, a group of points scatters upward toward trade counts of 22–26, representing elevated-volatility episodes. Several high-leverage outliers are visible — notably points near (1,031,530, 23.56), (1,035,061, 24.27), and (1,046,601, 24.14) — which appear to exert meaningful influence on the regression slope. Conversely, some low-X observations (e.g., ~732,000–800,000) cluster at moderate Y values (14–17), suggesting that very low-volatility days don't uniformly suppress trade counts, possibly indicating scheduled or algorithmic trading floors.
Confounding Factors and Interpretive Caveats Several important confounders complicate causal interpretation. Day-of-week and calendar effects (options expiration Fridays, month-end rebalancing, holiday-shortened sessions) independently drive both VIX movements and trading volumes. Macro event clustering in 2012 — Federal Reserve announcements, Eurozone summit outcomes, the U.S. fiscal cliff debate — likely created correlated spikes in both variables simultaneously, inflating r without implying a structural relationship. The unit mismatch deserves attention: the X-axis represents raw volume/notional data from Cboe's market volume dataset while the Y-axis is VIX closing values from FRED, and the axis labels in the provided data appear swapped from conventional expectation, warranting verification. Additionally, 2012 is a single calendar year, limiting generalizability; the correlation structure may differ substantially in bull or bear market regimes or periods of sustained low volatility (e.g., 2017).
Actionable Insights and Further Investigation Practitioners and researchers should not use VIX as a standalone predictor of near-term trade counts — the Granger test makes this clear. However, the contemporaneous correlation justifies using VIX as one component in a multi-factor intraday volume forecasting model, potentially alongside day-of-week dummies, options expiration indicators, and macro event calendars. Further investigation should explore: (1) non-linear modeling (e.g., spline regression or quantile regression) to better capture the apparent heteroscedasticity visible in the upper VIX range; (2) regime-segmented analysis separating low-, medium-, and high-volatility periods to test whether the correlation strengthens under stress conditions; and (3) lag structure exploration beyond one period — while the one-day Granger test was insignificant, weekly aggregation or multi-day lags might reveal a delayed volume response to volatility shocks. Finally, extending the dataset beyond a single year would substantially improve the reliability and generalizability of any derived trading or risk management rules.
X dataset: Cboe U.S. Equities Historical Market Volume Data 2012
Y dataset: VIX Volatility Index Daily (FRED)
Part of experiment: Daily - Cboe U.S. Equities Historical Market Volume Data 2012 vs VIX Volatility Index Daily (FRED)