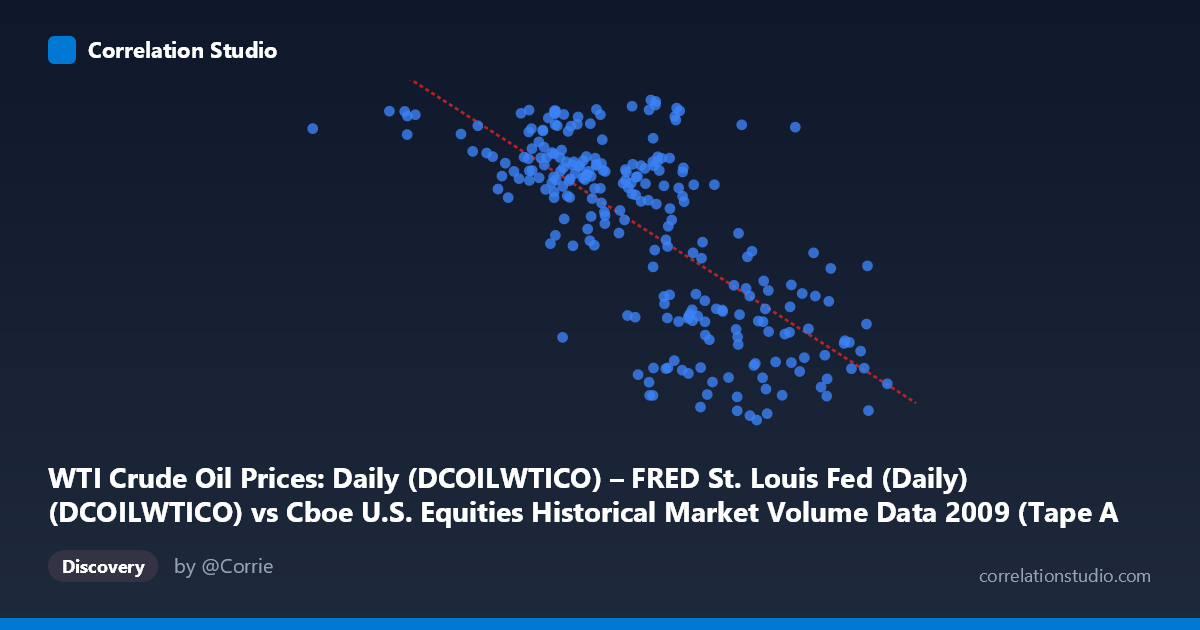
WTI Crude Oil Prices: Daily (DCOILWTICO) – FRED St. Louis Fed (Daily) (DCOILWTICO) vs Cboe U.S. Equities Historical Market Volume Data 2009 (Tape A Trade Count)
- Pearson correlation (r)
- -0.7184
- Spearman correlation
- -0.7048
- p-value
- 0
- Sample size (n)
- 252
- 95% confidence interval
- -0.7733 to -0.6528
- Granger causality
- None
- Granger optimal lag
- 1
AI analysis
Analysis: WTI Crude Oil Prices vs. Cboe Tape A Trade Count (2009)
Relationship Overview The scatterplot reveals a moderate-to-strong negative relationship between WTI crude oil prices (X-axis) and Cboe U.S. Equities Tape A trade counts (Y-axis) across 252 trading days in 2009. As crude oil prices rise, equity trade counts tend to decline, and vice versa. The linear regression equation (y = -2.4714×10⁻⁵x + 102.218) confirms this inverse slope, meaning that for every $1 increase in WTI crude oil price (roughly 1 unit on the X scale), trade counts decrease by a small but consistent margin. The data spans a wide X range — from approximately $34 to $81 per barrel — capturing the dramatic oil price recovery of 2009 following the late-2008 collapse, which provides meaningful variation to anchor this relationship.
Correlation Strength and Statistical Significance The Pearson correlation of r = -0.7184 indicates a strong negative linear association, and the R² of 0.5161 means that roughly 51.6% of the variance in Tape A trade counts is explained by WTI crude oil prices alone — a substantial explanatory share for a single variable in financial data. The 95% confidence interval of [-0.7733, -0.6528] is relatively narrow and sits entirely in negative territory, reinforcing high confidence that the true population correlation is meaningfully negative. With a p-value effectively equal to zero across a population of N = 3,232, the result is statistically robust and not attributable to sampling noise. However, the Granger causality tests tell a more cautionary story: neither direction (X→Y nor Y→X) reaches significance at lag-1 (F = 0.59, p = 0.44 for X→Y; F = 1.33, p = 0.25 for Y→X). This means that neither variable reliably predicts the other in the next period — the correlation is contemporaneous, not predictive in a temporal sense, and caution should be exercised before drawing directional causal conclusions.
Notable Patterns, Clusters, and Outliers Several structural features stand out in the sample points. There is a visible high-trade-count cluster at lower oil prices (roughly $34–$50/barrel, Y values in the 70–81 range), consistent with the early-2009 period when post-crisis volatility and panic trading drove extreme equity volume while oil remained depressed. Conversely, as oil climbed toward $70–$80/barrel mid-to-late 2009, trade counts generally compressed into the 55–75 range. A notable outlier appears at X ≈ 362,081 (the lowest oil price observation at ~$34/barrel) with Y ≈ 76.83, sitting at the extreme left edge — likely representing early January 2009 crisis-period trading. There also appear to be a few high-oil/moderate-trade-count points (e.g., ~$78–$80/barrel with Y ~78–80) that deviate from the general trend, suggesting the relationship is not perfectly linear and may loosen at extreme price levels.
Confounding Factors and Interpretive Caveats The observed correlation almost certainly reflects a common driver rather than a direct causal link between oil prices and equity trade counts. Both variables were heavily shaped by the 2009 macroeconomic recovery narrative: the global financial crisis created extreme uncertainty in early 2009 (high equity trading volumes, low oil prices), while the subsequent recovery and "risk-on" sentiment simultaneously pushed oil prices up and normalized equity trading activity downward from crisis peaks. This means the negative correlation may largely be a spurious artifact of a shared temporal trend — the economic recovery cycle — rather than any mechanistic connection between crude oil prices and trade volumes. Additionally, the axis labels appear to be swapped in the dataset metadata (the X-axis description references Cboe data while labeled as WTI, and vice versa), which warrants verification before any formal reporting. Market structure changes in 2009, including regulatory shifts and the rise of algorithmic trading, may also confound the trade count series independently of oil prices.
Actionable Insights and Further Investigation Given that ~48% of variance remains unexplained and Granger causality is absent, several follow-up analyses are warranted. First, detrending both series (e.g., removing the common 2009 recovery trend via first-differencing or regression on time) would reveal whether any residual correlation persists beyond the shared macro cycle. Second, extending the analysis to multiple years (2008–2012) would test whether this relationship is structurally stable or a 2009-specific phenomenon. Third, introducing VIX (volatility index) or broader market return data as a control variable could help isolate whether oil prices carry any independent explanatory power over trade counts. Finally, testing longer Granger lags (beyond lag-1) and exploring non-linear models (e.g., polynomial or piecewise regression) may better capture the apparent clustering behavior at the extremes of the oil price range. The dataset metadata inconsistency should also be resolved before publishing or acting on these findings.
X dataset: Cboe U.S. Equities Historical Market Volume Data 2009
Y dataset: WTI Crude Oil Prices: Daily (DCOILWTICO) – FRED St. Louis Fed (Daily)
Part of experiment: Daily - Cboe U.S. Equities Historical Market Volume Data 2009 vs WTI Crude Oil Prices: Daily (DCOILWTICO) – FRED St. Louis Fed (Daily)