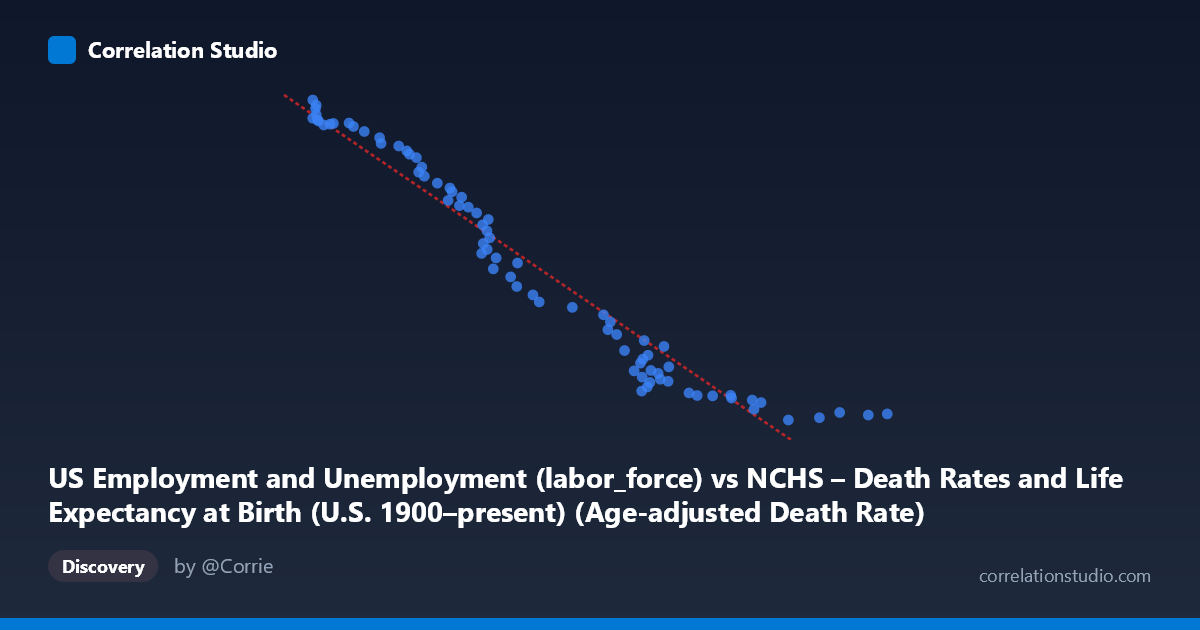
US Employment and Unemployment (labor_force) vs NCHS – Death Rates and Life Expectancy at Birth (U.S. 1900–present) (Age-adjusted Death Rate)
- Pearson correlation (r)
- -0.971
- Spearman correlation
- -0.9898
- p-value
- 0
- Sample size (n)
- 78
- 95% confidence interval
- -0.9815 to -0.9548
- Granger causality
- None
- Granger optimal lag
- 10
AI analysis
Analysis of U.S. Labor Force Size vs. Age-Adjusted Death Rate (1941–2018)
Relationship Overview
The scatterplot reveals a strikingly strong negative relationship between the U.S. labor force size and the age-adjusted death rate over the period 1941–2018. As the labor force (X) increases from roughly 777 to 1,830 (in hundreds of thousands or similar units), the age-adjusted death rate (Y) falls dramatically from approximately 162,000 down to near 54,000. The linear regression equation (y = −125.41x + 254,562) captures this inverse trajectory well, and the data points cluster tightly around this line with relatively little scatter, suggesting the relationship is remarkably consistent across nearly eight decades of annual observations.
Correlation Strength, Direction, and Causality
The Pearson correlation of r = −0.971 is exceptionally strong, and the R² of 0.943 means that 94.3% of the variance in age-adjusted death rates is statistically "explained" by labor force size in a purely mathematical sense. The 95% confidence interval for r [−0.982, −0.955] is narrow and entirely negative, confirming the direction and magnitude of the association with high precision. The p-value of effectively zero leaves no doubt about statistical significance. However, the Granger causality tests tell a critical story: neither X→Y (F = 1.51, p = 0.165) nor Y→X (F = 1.55, p = 0.152) reaches significance at conventional thresholds, even with an optimal lag of 10 periods. This means that despite the overwhelming correlational strength, neither variable demonstrably predicts the other temporally beyond what a shared time trend already explains — a vital caution against causal interpretation.
Patterns, Clusters, and Notable Features
The data points form a relatively smooth, slightly curved arc, hinting at a mild non-linear (possibly hyperbolic or logarithmic) component that the linear model approximates but does not perfectly capture — the residuals may be slightly larger at the extremes. A visible cluster of points in the lower-left region (labor force ~777–850, death rates ~150,000–162,000) corresponds to the early 1940s, while the upper-right cluster (labor force ~1,600–1,830, death rates ~54,000–62,000) represents the 2000s–2010s. There are no dramatic outliers, which itself is telling — the relationship is remarkably stable across the entire timespan with no obvious structural breaks or anomalies disrupting the trend.
Confounding Factors and Interpretive Caveats
This correlation almost certainly reflects two variables that are both driven by the passage of time — a classic case of spurious correlation mediated by a common temporal trend. Over 1941–2018, the U.S. labor force grew steadily due to population growth, demographic shifts (women entering the workforce, baby boom cohorts), and immigration. Simultaneously, age-adjusted death rates declined due to entirely separate forces: advances in medicine, public health infrastructure, improved nutrition, reduced smoking rates, and better management of cardiovascular disease and infectious illness. These causal drivers are largely independent of each other. The dataset labels also warrant scrutiny — the axis assignments appear inverted from their source datasets (labor force from a mortality dataset, death rates from an employment dataset), suggesting a data linkage artifact that should be verified before any substantive conclusions are drawn.
Actionable Insights and Further Investigation
Given the near-certain role of time as a shared confounder, the most important next step is to partial out the temporal trend — running a regression of both variables on year and examining whether the residuals remain correlated. If the residual correlation collapses (likely), it would confirm this is spurious. Researchers should also explore whether specific labor force subgroups (e.g., female labor force participation, which grew dramatically post-WWII) correlate more meaningfully with specific causes of death, as occupational health and income effects on mortality are legitimate research areas. Applying cointegration tests (e.g., Engle-Granger) would be more appropriate than Granger causality for these long-run non-stationary time series. Finally, controlling for GDP per capita, healthcare expenditure, and demographic composition would help isolate whether any genuine socioeconomic pathway connects employment trends to population health outcomes — a plausible mechanism worth rigorously testing rather than inferring from this correlation alone.
X dataset: NCHS – Death Rates and Life Expectancy at Birth (U.S. 1900–present)
Y dataset: US Employment and Unemployment
Part of experiment: Yearly - NCHS – Death Rates and Life Expectancy at Birth (U.S. 1900–present) vs US Employment and Unemployment