DataHub Commodity Prices v2 (Oil Dubai) vs Bitcoin Historical Price USD – All-Time Series (Habrador) (Price)
- Pearson correlation (r)
- 0.4493
- Spearman correlation
- 0.8049
- p-value
- 0
- Sample size (n)
- 182
- 95% confidence interval
- 0.3251 to 0.5583
- Granger causality
- None
- Granger optimal lag
- 1
- Time coverage
- 2010-08-01 to 2025-09-01
AI analysis
Analysis: Bitcoin Price vs. Dubai Oil Price
1. What the Visualization Reveals
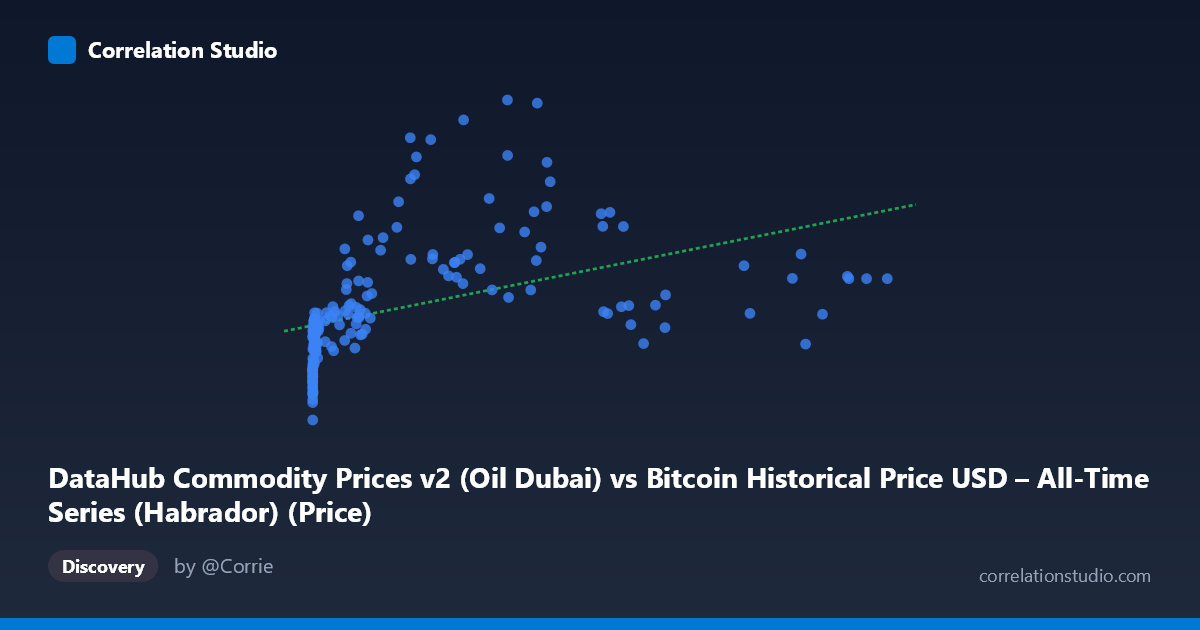
The scatterplot shows a positive but noisy relationship between Bitcoin's historical USD price (X-axis, spanning from fractions of a cent to over $113,500) and Dubai crude oil prices (Y-axis, ranging $142–$296). The extreme skew in the X variable (mean $17,943 vs. median likely much lower, given stdev of $27,080) means most data points cluster near the origin, with a long tail of high-Bitcoin-price observations pulling the trend upward. This is less a "relationship between two economic variables" and more a relationship between two independent time series that happen to trend upward over the same calendar period.
2. Strength, Direction, and Uncertainty
The Pearson correlation (r = 0.449, r² = 0.202) indicates a moderate positive association, but only about 20% of the variance in oil prices is explained by Bitcoin's price — leaving 80% unexplained by this relationship alone. The 95% CI [0.325, 0.558] is reasonably tight and excludes zero, and the p-value (1.99e-10) confirms this correlation is highly statistically significant — but statistical significance here reflects the large sample size and shared time trend, not necessarily a meaningful causal or economic link. Critically, Granger causality tests show no predictive relationship in either direction (p ≈ 0.97 for both X→Y and Y→X). This strongly suggests the correlation is not driven by one asset leading or forecasting the other — instead, both series likely reflect a common underlying driver (e.g., global liquidity, inflation, USD strength, or simply co-incident long-term uptrends) rather than any interdependent dynamic.
3. Notable Patterns and Non-linear Features
The data is highly non-linear in structure. At low Bitcoin prices (<$1,000, the majority of points), oil prices vary widely (155–190), with no clear trend — this is early Bitcoin history (2010–2013) where oil price movements are essentially unrelated noise. Only at high Bitcoin prices ($20,000) do we see oil prices climbing into the 200–296 range, but this coincides with 2021–2024, a period of significant global inflation affecting both commodities and crypto simultaneously. The note that Spearman's ρ exceeds Pearson's r confirms a monotonic but curved relationship — consistent with a log-linear or power-law pattern, which makes sense given Bitcoin's price grew across multiple orders of magnitude while oil stayed in a comparatively narrow band.
4. Confounding Factors and Caveats
This pairing has a fundamental temporal confound: both series are simply indexed by calendar time, not by any economic mechanism linking crypto and oil markets directly. Major confounders include: (a) global macroeconomic conditions (2021–2022 inflation surge affected nearly all asset classes), (b) USD strength/weakness affecting both dollar-denominated prices, (c) Bitcoin's exponential early growth curve mechanically creates a monotonic X-axis trend over time that will correlate with any other slowly trending series, and (d) the mismatched data granularity (Bitcoin's high-frequency price data paired with monthly commodity indices) may introduce alignment/sampling artifacts. This is a textbook case where correlation likely reflects spurious trend-matching rather than genuine market interdependency.
5. Recommendations for Further Investigation
Rather than raw price levels, analysis should use log-transformed Bitcoin prices (given its multi-order-of-magnitude range) and test returns or percentage changes rather than levels, which would strip out the shared long-term trend and reveal whether short-term co-movements exist. Additionally, testing against a common third factor (e.g., DXY dollar index, CPI, or M2 money supply) would help determine whether both series are proxies for the same macro trend. Given the null Granger causality result, this pairing should not be used for predictive/trading purposes — any apparent relationship is best explained as coincidental co-trending during a historically unique period of monetary expansion, not a tradeable or causal linkage between Bitcoin and oil markets.
X dataset: Bitcoin Historical Price USD – All-Time Series (Habrador)
Y dataset: DataHub Commodity Prices v2
Part of experiment: Bitcoin - Bitcoin Historical Price USD – All-Time Series (Habrador) vs DataHub Commodity Prices v2