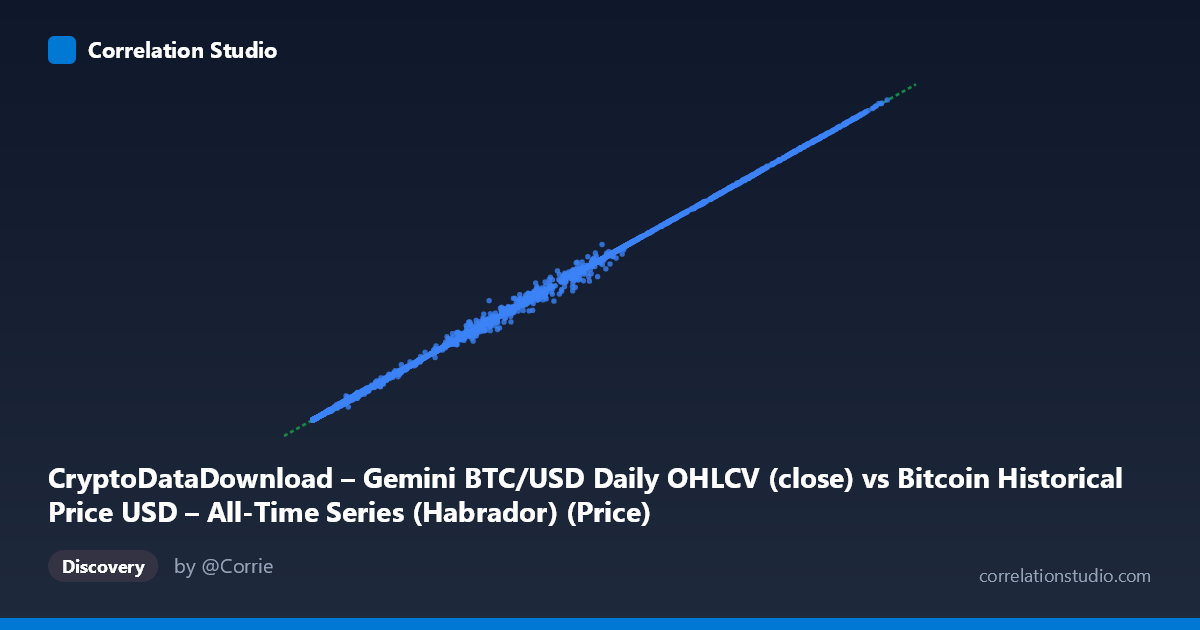
CryptoDataDownload – Gemini BTC/USD Daily OHLCV (close) vs Bitcoin Historical Price USD – All-Time Series (Habrador) (Price)
- Pearson correlation (r)
- 0.9998
- Spearman correlation
- 0.9998
- p-value
- 0
- Sample size (n)
- 3996
- 95% confidence interval
- 0.9998 to 0.9998
- Granger causality
- None
- Granger optimal lag
- 10
- Time coverage
- 2015-10-08 to 2026-09-15
- Recomputed on refreshed data
- 2026-10-24 (r was 0.9998)
AI analysis
Analysis: Bitcoin Price Cross-Reference (CryptoDataDownload/Gemini vs. Habrador All-Time Series)
1. Relationship Overview
The scatterplot shows an almost perfectly linear relationship between two Bitcoin price series spanning from ~$243 to ~$124,747. Points track tightly along the identity line (y ≈ 0.999x + 14.25), indicating these are not two independent economic variables but rather two records of the same underlying phenomenon — Bitcoin's daily closing price — sourced from different platforms (a general "all-time" historical dataset vs. Gemini exchange-specific OHLCV data).
2. Strength, Direction, and Statistical Meaning
The correlation is essentially maximal: r = 0.9998, r² = 0.9996, meaning 99.96% of the variance in one series is explained by the other. The 95% CI [0.9998, 0.9998] is vanishingly narrow, and p = 0 confirms this is not a chance association — with n = 3,856 paired daily observations, even minor deviations would register as significant. In practical terms, the slope (0.999) and near-zero intercept (14.25) confirm these are measuring the same asset at nearly the same price, not two causally linked but distinct phenomena. Consequently, the Granger causality results (no significant directionality, p ≈ 0.31 both ways) make sense: neither series "leads" the other because they aren't sequentially dependent time series in an economic sense — they're contemporaneous mirrors of the same market price, so standard lead-lag inference doesn't apply meaningfully here.
3. Notable Patterns and Deviations
While the fit is near-perfect at a macro scale, the sample points reveal small but consistent absolute deviations that scale with price — e.g., (48125.99, 49649.93), (19443.48, 21767.47), and (7460.62, 9600.00) show gaps of $1,500–$2,300, larger than deviations seen at lower price points like (452.11, 452.99). This is classic heteroscedasticity: variance in the difference between series grows with price level, likely reflecting exchange-specific volatility (Gemini vs. blended/other-exchange sourcing) during high-volatility trading days rather than data error. No clustering by regime (bull/bear) is apparent — deviations seem tied to daily volatility spikes rather than long-term divergence.
4. Caveats and Confounders
The central caveat: this is not two independent variables correlating — it's a data-integrity/reconciliation check between two sourcing methodologies for the same asset. High r² is expected and desirable, not economically meaningful in the way it would be for, say, price vs. trading volume. Differences likely stem from: (a) exchange-specific pricing (Gemini vs. a composite/different index), (b) timestamp/timezone alignment of "daily close," (c) potential gaps or interpolation in the "all-time" series during illiquid early years (2015 range floors around $243–$576 in samples). The population/sample mismatch (N=4,267 vs. n=3,856) suggests ~411 unmatched dates, possibly early history or exchange downtime, which could bias correlation slightly upward by excluding hard-to-reconcile points.
5. Suggested Next Steps
Rather than treating this as a causal relationship, use it as a data validation exercise: (1) plot the residuals (Y−X) over time to check whether divergence clusters around known high-volatility events (2017, 2021 bull runs) or exchange-specific anomalies; (2) investigate the 411 unmatched records to determine if they're systematically early-history gaps; (3) apply a percentage-based error metric (not absolute) given heteroscedasticity, to properly assess reconciliation quality at both low and high price regimes; (4) if building a unified price feed, consider Gemini as ground truth for exchange-specific analysis, using the "all-time" series only to backfill pre-Gemini history (pre-2015).
X dataset: Bitcoin Historical Price USD – All-Time Series (Habrador)
Y dataset: CryptoDataDownload – Gemini BTC/USD Daily OHLCV
Part of experiment: Bitcoin - Bitcoin Historical Price USD – All-Time Series (Habrador) vs CryptoDataDownload – Gemini BTC/USD Daily OHLCV