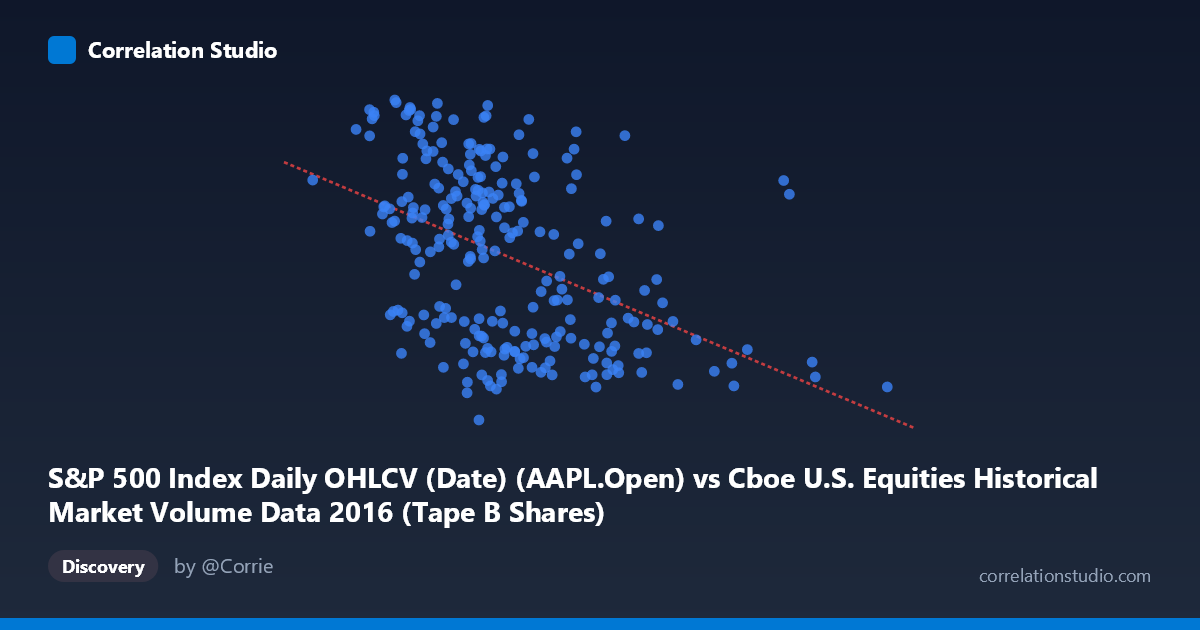
S&P 500 Index Daily OHLCV (Date) (AAPL.Open) vs Cboe U.S. Equities Historical Market Volume Data 2016 (Tape B Shares)
- Pearson correlation (r)
- -0.4474
- Spearman correlation
- -0.459
- p-value
- 0
- Sample size (n)
- 252
- 95% confidence interval
- -0.5411 to -0.3428
- Granger causality
- None
- Granger optimal lag
- 1
AI analysis
Scatterplot Analysis: AAPL Opening Price vs. Cboe Tape B Share Volume (2016)
Relationship Overview The scatterplot reveals a negative relationship between Apple's (AAPL) daily opening price on the S&P 500 and Cboe U.S. Equities Tape B share volume throughout 2016. The linear regression equation (y = -1.12117E-07x + 116.523) confirms this inverse trend: as AAPL's opening price increases, Tape B share volume tends to decline. Visually, the data points form a downward-sloping cloud, broadly consistent with the fitted line, though with considerable scatter throughout the range. The X-axis spans roughly $43.5M to $233.9M in price units, while Tape B volume ranges from 90 to ~118 shares (in normalized or indexed units).
Correlation Strength and Statistical Significance The Pearson correlation of r = -0.4474 indicates a moderate negative association. However, the coefficient of determination (r² = 0.2002) reveals that only ~20% of the variance in Tape B volume is explained by AAPL's opening price, meaning roughly 80% of the variability is attributable to other factors entirely. The 95% confidence interval for r spans [-0.5411, -0.3428], a relatively narrow band that does not cross zero, and the p-value of 8.33E-14 is extraordinarily small, confirming the correlation is highly statistically significant and extremely unlikely to be a chance finding given n = 252 paired observations. That said, statistical significance here is partly a function of the large sample size — the practical magnitude of the relationship remains modest. Crucially, Granger causality tests show no significant predictive directionality in either direction (X→Y: F = 1.67, p = 0.197; Y→X: F = 0.31, p = 0.580), meaning that past values of AAPL's opening price do not significantly predict future Tape B volume, and vice versa. This critically limits any causal or temporal forecasting interpretation.
Notable Patterns, Clusters, and Outliers The scatter plot exhibits a broad, diffuse cloud rather than a tight linear band, consistent with the modest r² value. Several notable features stand out. There appears to be a higher-density cluster of observations concentrated in the X range of approximately 75M–130M, corresponding to the bulk of AAPL's trading range in 2016 (~$93–$115). Within this cluster, Tape B volume shows high variance (~90–118), producing the wide vertical spread. At the upper end of the X range (150M, e.g., the point near 170.6M with volume ~97.06, or ~233.9M), there are sparse but notably low-volume observations, consistent with the negative slope and suggesting these higher-price days coincide with subdued Tape B activity. A few potential outliers are visible — specifically, some high-volume points (115) occurring at relatively low AAPL prices (~75–85M range), and the minimum volume observation (~90.00 at ~98.4M) sitting well below the main cluster, both of which may exert disproportionate influence on the regression fit.
Confounding Factors and Interpretive Caveats Several important caveats temper interpretation. First, the dataset column assignments appear counterintuitive — the X-axis is labeled as drawn from the Cboe volume dataset but contains AAPL opening price values, while the Y-axis is from the S&P 500 OHLCV dataset but contains Tape B share volume. This metadata mismatch warrants careful verification before drawing conclusions. Second, 2016 was a notable market year featuring elevated volatility around the U.S. presidential election (November), Brexit aftermath, and Federal Reserve rate decisions — all of which could independently drive both AAPL prices and exchange-wide Tape B volumes, acting as common confounders. Third, Tape B volume reflects a broad universe of NYSE MKT (AMEX)-listed securities, not just AAPL, meaning the correlation may reflect market-wide dynamics (e.g., risk-on/risk-off sentiment shifting capital flows) rather than any direct AAPL-specific mechanism. Fourth, the moderate scatter and absence of Granger causality suggest the observed correlation may be spurious or driven by a latent variable, such as overall market sentiment or volatility (VIX).
Actionable Insights and Further Investigation Given the statistically significant but practically limited correlation and absence of Granger causality, several next steps are warranted. Introduce VIX or overall S&P 500 index level as a control variable to test whether the AAPL–Tape B relationship survives after accounting for broad market conditions — if it disappears, the correlation is likely spurious. Segmenting the data temporally (e.g., pre- and post-election) could reveal whether the relationship is consistent across 2016 or driven by specific high-volatility episodes. A rolling correlation analysis would clarify whether the r = -0.45 relationship is stable across the year or episodic. Additionally, non-linear modeling (e.g., polynomial regression or LOESS smoothing) should be explored, given the wide scatter and possible heteroscedasticity visible at higher X values. Finally, confirming the metadata and column-source alignment is an essential prerequisite before any business or investment decisions are grounded in this analysis.
X dataset: Cboe U.S. Equities Historical Market Volume Data 2016
Y dataset: S&P 500 Index Daily OHLCV (Date)
Part of experiment: Daily - Cboe U.S. Equities Historical Market Volume Data 2016 vs S&P 500 Index Daily OHLCV (Date)