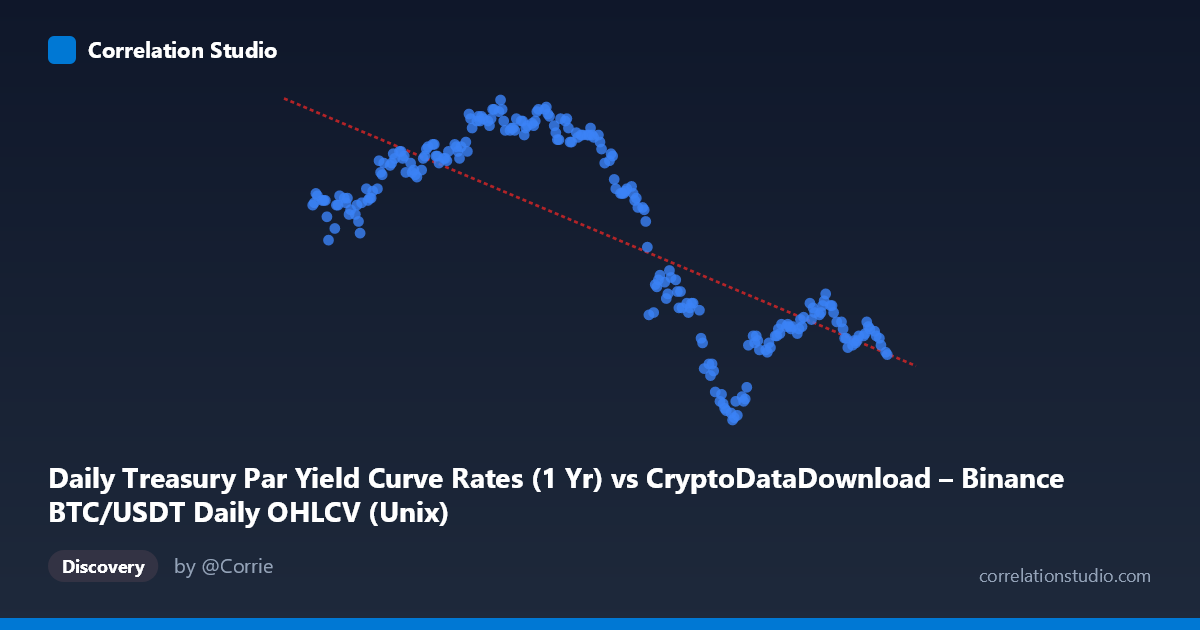
Daily Treasury Par Yield Curve Rates (1 Yr) vs CryptoDataDownload – Binance BTC/USDT Daily OHLCV (Unix)
- Pearson correlation (r)
- -0.7486
- Spearman correlation
- -0.663
- p-value
- 0
- Sample size (n)
- 250
- 95% confidence interval
- -0.7985 to -0.6884
- Granger causality
- None
- Granger optimal lag
- 1
AI analysis
Analysis: Treasury 1-Yr Yield vs. Time (mislabeled BTC/USDT series)
Note on axes: The column labels appear swapped in the metadata — the X-axis values (1.7 trillion range) are clearly Unix timestamps spanning Jan–Dec 2024, while the Y-axis values (3.88–5.25) are clearly the 1-Year Treasury Par Yield in percent. The "BTC/USDT OHLCV" labels seem to be dataset-source artifacts rather than actual plotted variables. This analysis proceeds treating X as time and Y as 1-Yr Treasury Yield.
1. What the Visualization Reveals The scatterplot shows a clear downward trend in the 1-Year Treasury yield across 2024. Yields start near 4.7–5.0% in January, rise slightly to a peak around 5.15–5.21% in April–June, then decline steadily through the second half of the year, ending near 4.17–4.28% by late December. This is a classic monetary-policy trajectory, consistent with market anticipation and eventual execution of Fed rate cuts during the latter half of 2024.
2. Strength, Direction, and Statistical Confidence The correlation coefficient (r = -0.7486) indicates a strong negative relationship between time and yield. The r² of 0.56 means 56% of the variance in yield levels is explained by the linear time trend — meaningful but leaving substantial residual variation (44%) driven by other factors (Fed meetings, inflation prints, employment data, etc.). The 95% CI [-0.7985, -0.6884] is tight and entirely negative, and the p-value of ~0 confirms this trend is not due to chance. However, the Granger causality test found no significant predictive direction (X→Y: p=0.20; Y→X: p=0.78) at lag 1 — meaning time itself doesn't "cause" yields in a forecasting sense (unsurprising, since time is a deterministic index, not a causal economic driver). This underscores that the correlation reflects a secular trend, not a dynamic feedback relationship.
3. Notable Patterns and Non-linearities The data is not purely linear — it resembles an inverted-U (hump) shape: yields rise modestly from January through a peak around April–June (~5.1–5.2%), then decline more steeply and consistently from July onward. This suggests two distinct regimes: a "higher for longer" phase in H1 2024, followed by a sustained easing phase in H2. The steep, low-noise decline in H2 (values tightly clustered by date, e.g., 4.2–4.3% in Nov, ~4.17–4.22% in late Dec) suggests markets priced in cuts with increasing confidence and lower volatility as the year closed.
4. Confounding Factors and Caveats Since X is a time index, "correlation" here really captures a trend-following pattern, not a causal driver — the true causes are macro events (FOMC decisions, CPI/PCE releases, labor market data, geopolitical shocks) that coincide with time but aren't captured in this bivariate model. Linear r² likely understates fit quality since the true shape is non-monotonic (hump-shaped); a piecewise or polynomial model would likely raise explained variance substantially. Additionally, daily Treasury yields are highly autocorrelated (non-independent observations), which can inflate apparent statistical significance in naive correlation tests.
5. Suggestions for Further Investigation - Fit a non-linear model (quadratic, spline, or regime-switching) to better capture the H1 rise / H2 decline structure. - Overlay FOMC meeting dates and CPI release dates to identify which specific events drove inflection points. - Test Granger causality with actual economic variables (e.g., inflation expectations, Fed funds futures) rather than a time index, since time cannot meaningfully "predict" or "be predicted by" yield. - If the intent was truly to compare BTC/USDT price against Treasury yields, the dataset should be corrected/re-extracted, as that comparison (crypto risk asset vs. risk-free rate) would offer more economically meaningful insight than yield-vs-time.
X dataset: CryptoDataDownload – Binance BTC/USDT Daily OHLCV
Y dataset: Daily Treasury Par Yield Curve Rates
Part of experiment: Bitcoin - CryptoDataDownload – Binance BTC/USDT Daily OHLCV vs Daily Treasury Par Yield Curve Rates