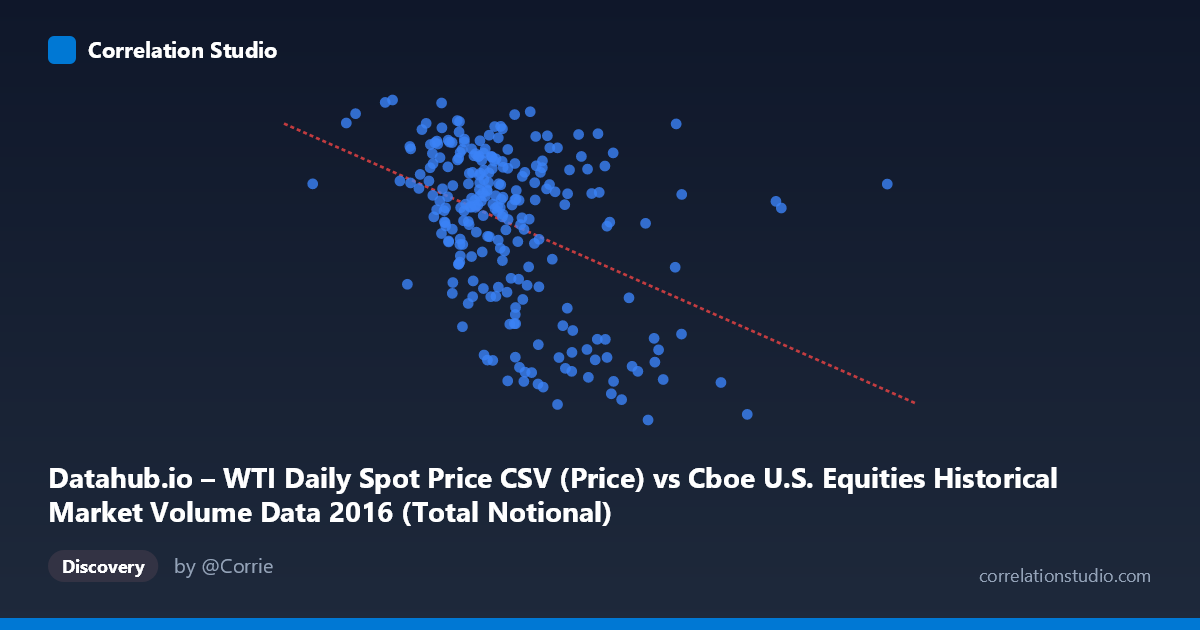
Datahub.io – WTI Daily Spot Price CSV (Price) vs Cboe U.S. Equities Historical Market Volume Data 2016 (Total Notional)
- Pearson correlation (r)
- -0.4188
- Spearman correlation
- -0.3922
- p-value
- 0
- Sample size (n)
- 252
- 95% confidence interval
- -0.5157 to -0.3114
- Granger causality
- None
- Granger optimal lag
- 1
AI analysis
Scatterplot Analysis: WTI Crude Oil Price vs. U.S. Equities Market Volume (2016)
Relationship Overview
The scatterplot reveals a moderate negative relationship between U.S. equities market trading volume (measured in total notional value on the X-axis) and WTI crude oil spot prices (Y-axis) across 252 trading days in 2016. The linear regression equation (y = -6.63×10⁻¹⁰x + 55.90) confirms this inverse relationship: as daily equity market notional volume increases, WTI crude oil prices tend to decline. Visually, the data cloud slopes downward from left to right, though with considerable scatter. The bulk of observations cluster in the X range of roughly $14–22 billion in notional volume and $40–52/barrel for oil, with a recognizable but noisy downward trend embedded within that cluster.
Correlation Strength and Statistical Significance
The Pearson correlation of r = -0.4188 indicates a moderate negative association, but the explanatory power is notably limited: r² = 0.1754, meaning only 17.5% of the variance in WTI crude oil prices is statistically explained by equity market volume. The remaining ~82.5% of oil price variation is attributable to other factors entirely. The 95% confidence interval of [-0.5157, -0.3114] confirms the direction is robustly negative — zero is well outside this interval — and the p-value of 3.997×10⁻¹² makes it virtually certain this correlation did not arise by chance given the full population context (N = 3,622). However, statistical significance should not be conflated with practical magnitude; the relationship is real but weak in predictive terms. Critically, Granger causality tests find no significant temporal predictive direction in either direction (X→Y: F = 0.553, p = 0.458; Y→X: F = 0.464, p = 0.497), meaning that knowing yesterday's equity volume does not meaningfully help predict today's oil price, and vice versa. This is an important constraint: the correlation is contemporaneous in nature, not predictive.
Patterns, Clusters, and Outliers
Several structural features stand out in the data. There appears to be a dense central cluster of points between approximately $16–19 billion in notional volume and $40–50/barrel, where the negative trend is less visually pronounced. However, a set of high-volume, low-price outliers — notably points near ($25B, ~$29–30), ($24B, ~$33), and ($23.5B, ~$32) — exert considerable leverage on the regression line and likely drive much of the observed correlation. These may correspond to specific market stress events in early 2016 when oil prices hit multi-year lows and equity market volatility (and thus volume) was elevated. Conversely, observations at lower volume levels (e.g., ~$12–14B) tend to cluster at relatively higher oil prices ($46–51/barrel), consistent with a calmer, lower-volume market environment later in the year as oil recovered. The relationship does not appear strongly nonlinear, but the high-leverage outlier cluster warrants scrutiny.
Confounding Factors and Interpretive Caveats
The most significant caveat is that both variables were simultaneously influenced by broader macro-financial conditions in 2016 — particularly the energy sector selloff and market volatility in Q1 2016, and the post-U.S. election rally in Q4 2016. High equity trading volume during stress periods and low oil prices during the same stress periods could produce a spurious-looking correlation driven entirely by this shared third-factor exposure (market risk sentiment). Additionally, the axis labeling appears swapped from the dataset descriptions — the X-axis is labeled as WTI price data but attributed to the equities volume dataset, and vice versa — which warrants verification before drawing firm conclusions. The single-lag Granger test may also be insufficient to capture longer-lag dynamics; oil market fundamentals can take weeks to transmit to equity market behavior or vice versa.
Actionable Insights and Further Investigation
Given the leverage of the early-2016 outlier cluster, a breakpoint or regime analysis separating Q1 2016 (high volatility, low oil) from the rest of the year would clarify whether the correlation is consistent across market conditions or driven by a single stress episode. Incorporating a volatility proxy (e.g., VIX) or broader risk-sentiment indicator as a control variable would help disentangle the correlation from shared macro drivers. Extending the Granger causality analysis to lags of 5–20 trading days could reveal slower-moving predictive relationships not captured at lag-1. Finally, given that only 17.5% of oil price variance is explained, multivariate modeling that incorporates inventory data, dollar index movements, and geopolitical event flags would provide a far more actionable forecasting framework than this bivariate relationship alone.
X dataset: Cboe U.S. Equities Historical Market Volume Data 2016
Y dataset: Datahub.io – WTI Daily Spot Price CSV
Part of experiment: Daily - Cboe U.S. Equities Historical Market Volume Data 2016 vs Datahub.io – WTI Daily Spot Price CSV