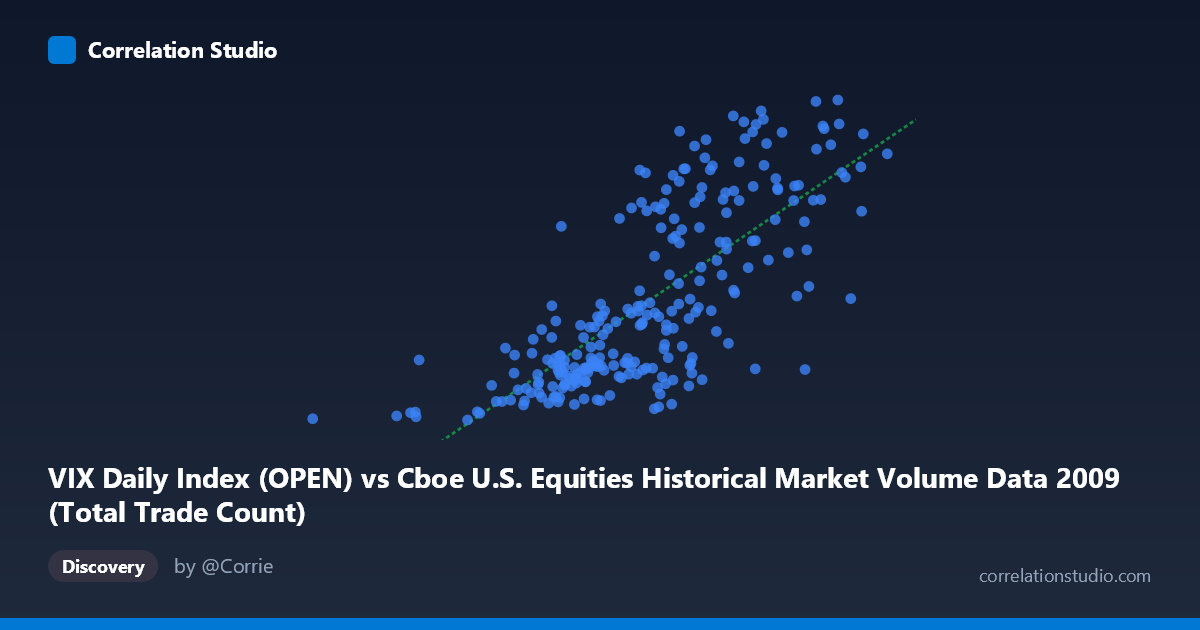
VIX Daily Index (OPEN) vs Cboe U.S. Equities Historical Market Volume Data 2009 (Total Trade Count)
- Pearson correlation (r)
- 0.7491
- Spearman correlation
- 0.7622
- p-value
- 0
- Sample size (n)
- 252
- 95% confidence interval
- 0.6893 to 0.7987
- Granger causality
- None
- Granger optimal lag
- 1
AI analysis
Scatterplot Analysis: VIX Daily Index (Open) vs. Total Trade Count (2009)
Relationship Overview The scatterplot reveals a moderately strong positive relationship between the VIX Daily Index open values and the total trade count on U.S. equities exchanges throughout 2009. As VIX levels rise — indicating greater market uncertainty and fear — trading activity as measured by total trade count also tends to increase. This is conceptually intuitive: heightened volatility typically drives more active market participation, as traders react to rapidly shifting prices, execute hedging strategies, and attempt to capitalize on short-term price dislocations. The linear regression equation (y = 1.15×10⁻⁵x + 1.071) confirms this upward slope, though the intercept suggests a non-trivial baseline trade count exists even at low VIX levels.
Correlation Strength and Statistical Interpretation With r = 0.749 and r² = 0.561, approximately 56.1% of the variance in total trade count is explained by the VIX open level — a meaningful but far from complete explanatory relationship. The remaining ~44% of variance is driven by other factors not captured by this single predictor. The 95% confidence interval for r of [0.689, 0.799] is relatively tight, reflecting good precision given the sample of n = 252 paired observations drawn from a population of N = 3,232. The p-value of essentially zero confirms the relationship is highly statistically significant and extremely unlikely to be a chance artifact. However, the Granger causality results tell a more cautionary story: neither direction (X→Y nor Y→X) yields significant predictability at an optimal lag of 1 period (F = 0.427, p = 0.514 for X→Y; F = 0.155, p = 0.694 for Y→X). This means that while VIX and trade count move together, past values of VIX do not reliably predict future trade counts and vice versa — the relationship is contemporaneous rather than directionally causal in a temporal sense.
Notable Patterns, Clusters, and Outliers The scatterplot exhibits several visually distinct features. There appears to be a lower cluster of points concentrated at lower VIX values (roughly below 30) with relatively modest trade counts, which likely corresponds to the second half of 2009 as markets stabilized following the post-crisis peak. A second, more dispersed upper cluster at higher VIX values and elevated trade counts likely reflects the volatile early months of 2009, when markets were still digesting the fallout of the 2008 financial crisis. Notably, a few outlier points appear in the upper-right quadrant with both very high VIX readings (near 50+) and very high trade counts, consistent with extreme volatility days. Conversely, one notable outlier at X ≈ 629,671 and Y ≈ 19.67 appears well separated from the main distribution on the low end, possibly representing an unusual low-volume, low-volatility day or a data anomaly. Some non-linearity may be present, as the relationship appears to steepen at higher VIX levels, suggesting a potentially exponential or piecewise dynamic rather than a purely linear one.
Confounding Factors and Caveats Several important caveats apply to interpreting this correlation. Temporal confounding is significant: the 2009 time window spans both the tail of the financial crisis (very high VIX) and the early recovery period (declining VIX), meaning the correlation may partly reflect a shared time trend rather than a direct mechanistic link. Both variables declining together over the year as conditions normalized could inflate the observed correlation. Additionally, market structure changes in 2009 — including the proliferation of high-frequency trading and electronic market-making — may independently affect trade counts in ways uncorrelated with volatility. The VIX itself is a forward-looking measure derived from options pricing, while trade count is a realized activity measure, making their conceptual alignment imperfect. Finally, the axes appear to be reversed from their natural labeling (VIX is described as X but sourced from a trade volume dataset, and vice versa), suggesting possible metadata misalignment that warrants verification before drawing firm conclusions.
Actionable Insights and Further Investigation Practitioners and researchers should consider several next steps. First, controlling for date/time trends using detrended or first-differenced series would help isolate whether the VIX-trade count relationship holds beyond the shared temporal arc of crisis-to-recovery. Second, fitting a non-linear model (e.g., log-log or polynomial regression) could improve upon the 56.1% explained variance, given the apparent heteroscedasticity and potential curvature in the scatter. Third, since Granger causality is absent at lag 1, testing longer lag structures (2–5 days) or intraday data might reveal delayed predictive dynamics. Fourth, segmenting the data by market regime (e.g., pre/post VIX peak in early 2009) could reveal whether the correlation is stable across calm and turbulent periods or driven entirely by the crisis-period observations. Finally, incorporating additional predictors such as options volume, bid-ask spreads, or news sentiment indices could build a more robust multivariate model of trading activity.
X dataset: Cboe U.S. Equities Historical Market Volume Data 2009
Y dataset: VIX Daily Index
Part of experiment: Daily - Cboe U.S. Equities Historical Market Volume Data 2009 vs VIX Daily Index