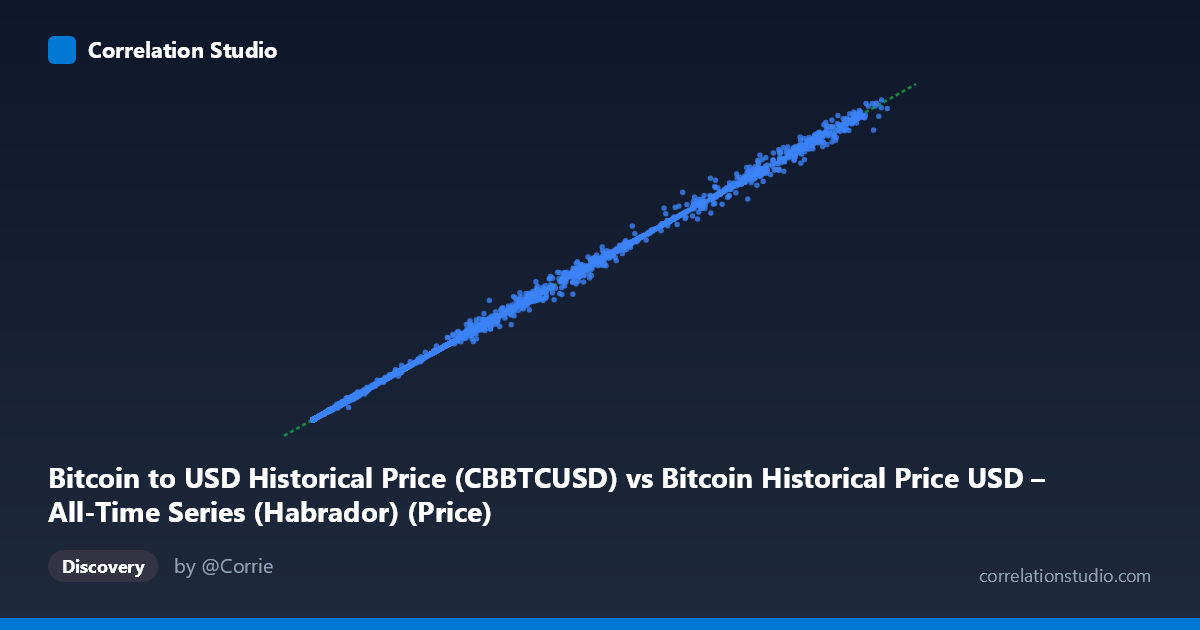
Bitcoin to USD Historical Price (CBBTCUSD) vs Bitcoin Historical Price USD – All-Time Series (Habrador) (Price)
- Pearson correlation (r)
- 0.9996
- Spearman correlation
- 0.9998
- p-value
- 0
- Sample size (n)
- 4272
- 95% confidence interval
- 0.9996 to 0.9996
- Granger causality
- None
- Granger optimal lag
- 10
- Time coverage
- 2014-12-01 to 2026-09-15
- Recomputed on refreshed data
- 2026-10-24 (r was 0.9996)
AI analysis
Analysis: Bitcoin Price Series Cross-Comparison (CBBTCUSD vs. Coinbase Historical Price)
1. What the Visualization Reveals
The scatterplot shows an almost perfect linear relationship between two Bitcoin price series spanning from late 2014 through early 2026. Points trace a tight diagonal line from near-zero values (~$120-300) up through mid-range prices (~$10,000-30,000) to extreme values (~$95,000-125,000), with virtually no dispersion around the fitted line. The regression equation (y ≈ 0.9995x + 25.17) with a slope essentially equal to 1 and a near-zero intercept indicates these two series are measuring the same underlying quantity — Bitcoin's USD price — rather than two genuinely distinct variables with an empirical relationship.
2. Strength, Direction, and Statistical Confidence
The correlation (r = 0.9996, r² = 0.9992) means over 99.9% of the variance in one series is explained by the other — a near-tautological fit rather than a typical "strong correlation" between independent phenomena. The 95% CI [0.9996, 0.9996] is essentially a point estimate, reflecting the large sample size (n=4,132) and the deterministic nature of the relationship; the p-value of 0 simply confirms this is not due to chance. Notably, the Granger causality tests show no significant predictive direction in either direction (X→Y: p=0.38; Y→X: p=0.37). This is expected and important: when two series are contemporaneous measurements of the same asset, neither "causes" the other in a temporal/predictive sense — they move together simultaneously, not sequentially.
3. Notable Patterns and Outliers
The data spans multiple orders of magnitude (from ~$120 to ~$125,000), consistent with Bitcoin's full historical trajectory through several bull/bear cycles. A few sample points show minor divergence — e.g., (7955.31, 4980.00), (49184.21, 46924.16), and (52165.30, 51644.16) — where Y is noticeably lower than X (deviations of 15-30%). These likely represent days with high intraday volatility where the two data sources (Coinbase feed vs. the Habrador historical series) captured different snapshot times or used different aggregation methods (e.g., open vs. close, or different exchange composites). Otherwise, the relationship holds tightly across all price regimes, including the extreme high-price tail (~$95K-125K), suggesting no systematic breakdown at scale.
4. Confounding Factors and Caveats
The central caveat is that this is not a correlation between two independent economic variables — it's a consistency check between two overlapping historical price datasets for the same asset (Bitcoin/USD), likely sourced from different exchanges or aggregation methodologies (Coinbase vs. a compiled "all-time series"). High r² here reflects data redundancy, not a meaningful economic relationship. The Granger non-causality result reinforces this: true causal/predictive relationships aren't expected or meaningful when comparing near-identical measurements of the same phenomenon. Time-coverage overlap (2014-2026) also means any macro trends (adoption growth, volatility clustering) are shared by both series by construction, inflating apparent "correlation" further.
5. Actionable Insights
Rather than treating this as a discovery of relationship, the analysis is best used as a data quality / reconciliation exercise: (1) investigate the small subset of points with notable deviations (10-15%) to identify timestamp misalignment, exchange discrepancies, or data entry errors; (2) if merging these datasets, use the regression (slope≈1, intercept≈25) to validate consistency and flag outliers exceeding a residual threshold (e.g., 5%) for manual review; (3) for any downstream analysis (e.g., volatility modeling, trading strategy backtesting), select one authoritative source rather than both, since combining near-duplicate series adds no information and risks double-counting variance in multivariate models.
X dataset: Bitcoin Historical Price USD – All-Time Series (Habrador)
Y dataset: Bitcoin to USD Historical Price
Part of experiment: Bitcoin - Bitcoin Historical Price USD – All-Time Series (Habrador) vs Bitcoin to USD Historical Price