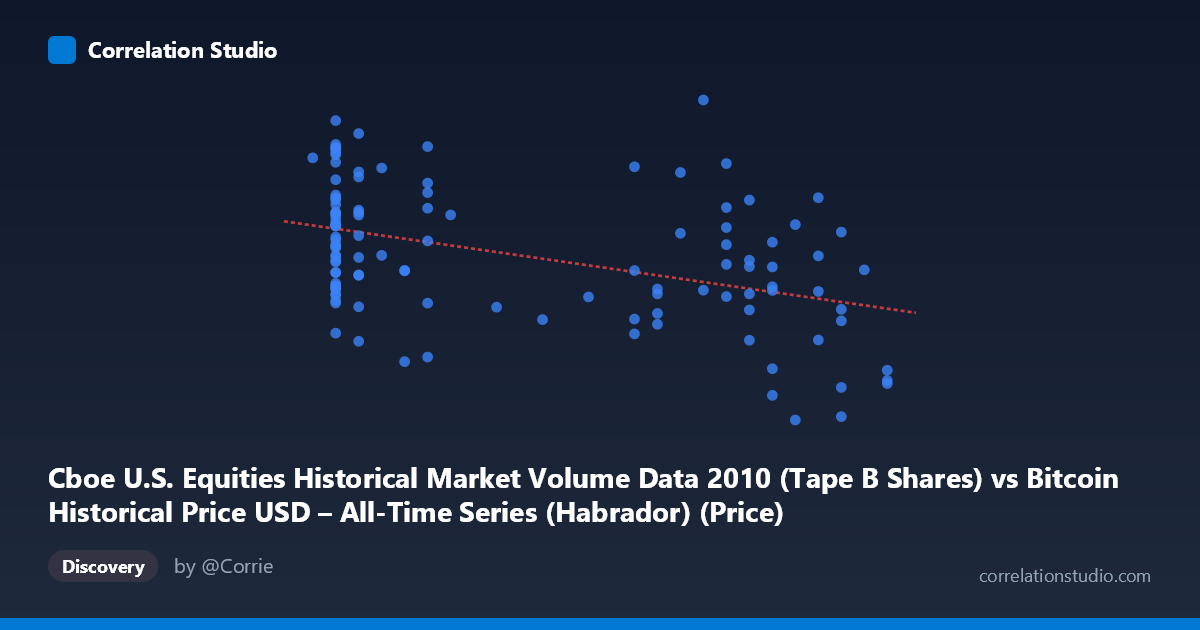
Cboe U.S. Equities Historical Market Volume Data 2010 (Tape B Shares) vs Bitcoin Historical Price USD – All-Time Series (Habrador) (Price)
- Pearson correlation (r)
- -0.4335
- Spearman correlation
- -0.4013
- p-value
- 0.000001
- Sample size (n)
- 117
- 95% confidence interval
- -0.5702 to -0.2735
- Granger causality
- None
- Granger optimal lag
- 10
AI analysis
Analysis: Cboe Equities Volume vs. Bitcoin Price (2010)
1. Relationship Overview The scatterplot shows a moderate negative linear trend between Tape B equity volume (X) and Bitcoin price (Y) during the latter half of 2010. As X increases from roughly 0.06 to 0.30, Y values trend downward from a cluster averaging near 90-100M toward the 50-80M range, though with substantial scatter throughout. The regression line (slope ≈ -103.8M) confirms this inverse relationship, but the wide vertical spread at every X value indicates the relationship is far from deterministic.
2. Strength, Direction, and Statistical Confidence The correlation coefficient (r = -0.4335) indicates a moderate negative relationship, but r² = 0.1879 reveals that only 18.8% of the variance in Y is explained by X — meaning over 80% of the variability is driven by other factors entirely outside this bivariate relationship. The 95% CI [-0.5702, -0.2735] is reasonably tight and excludes zero, and the p-value (1.05E-06) confirms this correlation is highly statistically significant — unlikely to be due to chance given n=117. However, statistical significance here reflects strength of confidence in a weak-to-moderate effect, not practical predictive power. Critically, the Granger causality tests (p = 0.68 and p = 0.84 for both directions) show no evidence of temporal predictive causality in either direction. This means neither variable's past values help forecast the other's future values — the correlation is likely contemporaneous/coincidental or driven by a shared external trend (e.g., both series evolving over the same 2010 timeframe) rather than one causing changes in the other.
3. Patterns and Outliers Several notable clusters emerge: - A dense cluster of low-X points (~0.06-0.10) with high variance in Y, ranging from ~55M to 131M — suggesting X alone poorly constrains Y in this region. - A mid-range cluster (X ≈ 0.19-0.28) with more compressed Y values (60-115M), fitting the downward trend more consistently. - One clear outlier: (0.22, 137.3M) sits well above the general trend, likely exerting leverage on the regression fit. - High-X points (X ≈ 0.30) consistently show the lowest Y values (~49-53M), the tightest sub-cluster in the dataset — potentially the strongest support for a genuine negative relationship at the extremes.
4. Confounding Factors and Caveats This pairing is unusual and likely spurious in a causal sense: Bitcoin price (a nascent, thinly-traded asset in 2010) and Cboe equity Tape B volume (mainstream U.S. stock market activity) have no plausible economic mechanism linking them directly. Both series likely reflect independent time trends within the same 6-month window — Bitcoin was in early price discovery with extreme volatility on tiny volume, while equity market volumes follow separate macro/seasonal drivers. The negative correlation is more plausibly an artifact of both variables trending over calendar time (autocorrelation in each series) rather than genuine interaction — a classic case of spurious correlation via a shared time trend, which the lack of Granger causality supports.
5. Suggestions for Further Investigation - De-trend both series (e.g., first-difference or detrend by date) before correlating, to test whether the relationship survives once shared time-trend effects are removed. - Investigate whether a third variable (overall market sentiment, USD liquidity, or simply chronological drift) better explains both trends. - Given the mismatched economic context (Bitcoin’s market cap in 2010 was negligible vs. Cboe volumes), treat this correlation as descriptive/coincidental rather than a candidate trading or economic signal. - If exploring further, plot both series against time independently first — this will likely clarify whether the negative correlation is simply two unrelated downward/upward trends coinciding over the same period.
X dataset: Bitcoin Historical Price USD – All-Time Series (Habrador)
Y dataset: Cboe U.S. Equities Historical Market Volume Data 2010
Part of experiment: Bitcoin - Bitcoin Historical Price USD – All-Time Series (Habrador) vs Cboe U.S. Equities Historical Market Volume Data 2010