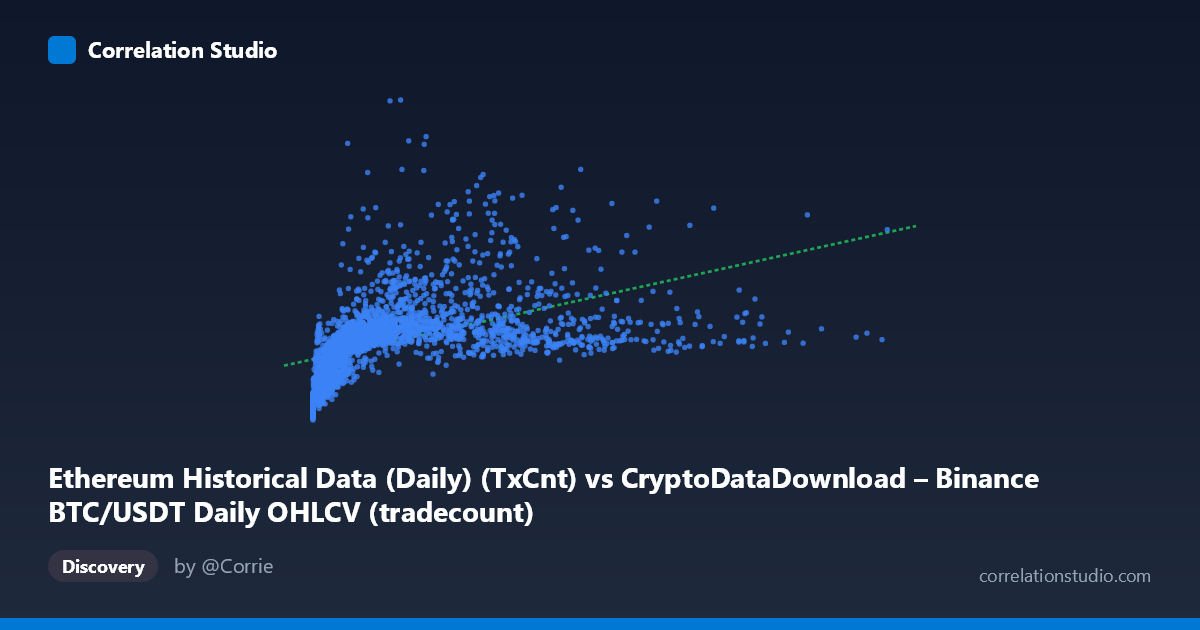
Ethereum Historical Data (Daily) (TxCnt) vs CryptoDataDownload – Binance BTC/USDT Daily OHLCV (tradecount)
- Pearson correlation (r)
- 0.4927
- Spearman correlation
- 0.7665
- p-value
- 0
- Sample size (n)
- 3191
- 95% confidence interval
- 0.4659 to 0.5185
- Granger causality
- None
- Granger optimal lag
- 10
AI analysis
Analysis of Ethereum Transaction Count vs. Binance BTC/USDT Trade Count
1. Relationship Overview
The scatterplot reveals a moderate positive correlation (r = 0.4927) between Ethereum's daily transaction count and Binance BTC/USDT daily trade count. The data shows a clear upward trend, but with substantial scatter around the regression line (y = 0.0869x + 898,712), indicating the relationship is real but far from deterministic. Most points cluster in the lower-left region (X < 3,000,000; Y between 900,000–1,500,000), with a long right tail of high-transaction-count days that pull the trend line upward.
2. Strength, Direction, and Uncertainty
With r² = 0.2427, only about 24% of the variance in BTC trade count is explained by Ethereum transaction count — meaning 76% of the variation is driven by other factors entirely unaccounted for in this bivariate relationship. The correlation is statistically robust (95% CI: [0.466, 0.518], p ≈ 0), so we can be confident the true population correlation is positive and non-trivial — but "statistically significant" here reflects the large sample size (n = 3,191) more than practical predictive power. Critically, the Granger causality tests show no significant temporal lead-lag relationship in either direction (X→Y: p = 0.43; Y→X: p = 0.54), even at an optimal lag of 10 days. This strongly suggests the correlation is not causal in a time-series sense — neither variable helps forecast the other's future values. The relationship is likely driven by both series responding to a shared external factor (e.g., overall crypto market activity, sentiment, or bull/bear cycles) rather than one influencing the other directly.
3. Notable Patterns and Outliers
Several features stand out: - Non-linearity: The note that Spearman ρ exceeds Pearson r confirms the relationship is better described as monotonic-but-curved rather than strictly linear — likely logarithmic or power-law, common in volume/activity metrics that scale non-uniformly. - Heteroscedasticity: Scatter appears to widen as X increases — at low ETH tx counts, Y is tightly bound (600K–1.5M), but at high X (4M), Y ranges more widely (1M–2.4M+), suggesting variance grows with the predictor. - High-leverage outliers: Points like (15,364,010 max X) and (8,268,695, 2,027,183) sit far from the bulk of the data and could disproportionately influence the linear fit. - Low-X cluster: Several points near X ≈ 0–12,000 with Y around 300,000–500,000 appear to represent early historical data (2017-era), possibly reflecting a structurally different market regime (low liquidity, fewer participants).
4. Confounding Factors and Caveats
This correlation likely reflects co-movement with broader crypto market cycles rather than a direct mechanical link between Ethereum network usage and Binance BTC trading activity. Confounders include: - Overall market sentiment/volatility (bull runs increase both ETH on-chain activity and BTC trading volume simultaneously) - Time trend/growth: Both metrics may simply be trending upward over the 2017–2026 period due to broader crypto adoption, creating spurious correlation - Structural breaks: Network upgrades (e.g., Ethereum's Merge, EIP-1559) and exchange-specific events (listing changes, fee structures) could shift one series independently of the other - Mismatched units/scales: Comparing a blockchain-native metric (ETH tx count) to an exchange-specific metric (BTC trade count) mixes on-chain and off-chain dynamics
5. Recommendations for Further Investigation
- Detrend both series (e.g., first-differencing or removing a rolling trend) before re-testing correlation and Granger causality to rule out spurious trend-driven correlation. - Fit a log-log or polynomial model given the Spearman/Pearson discrepancy — this may substantially improve explained variance. - Segment by market regime (bull vs. bear vs. sideways periods) to check if the correlation strengthens or weakens during high-volatility phases. - Investigate a genuine common driver — e.g., total crypto market cap or a volatility index — as a potential mediating variable explaining both series simultaneously. - Given the lack of Granger causality, avoid using either series as a leading indicator for the other in forecasting models; treat the correlation as descriptive/contemporaneous only.
X dataset: CryptoDataDownload – Binance BTC/USDT Daily OHLCV
Y dataset: Ethereum Historical Data (Daily)
Part of experiment: Bitcoin - CryptoDataDownload – Binance BTC/USDT Daily OHLCV vs Ethereum Historical Data (Daily)