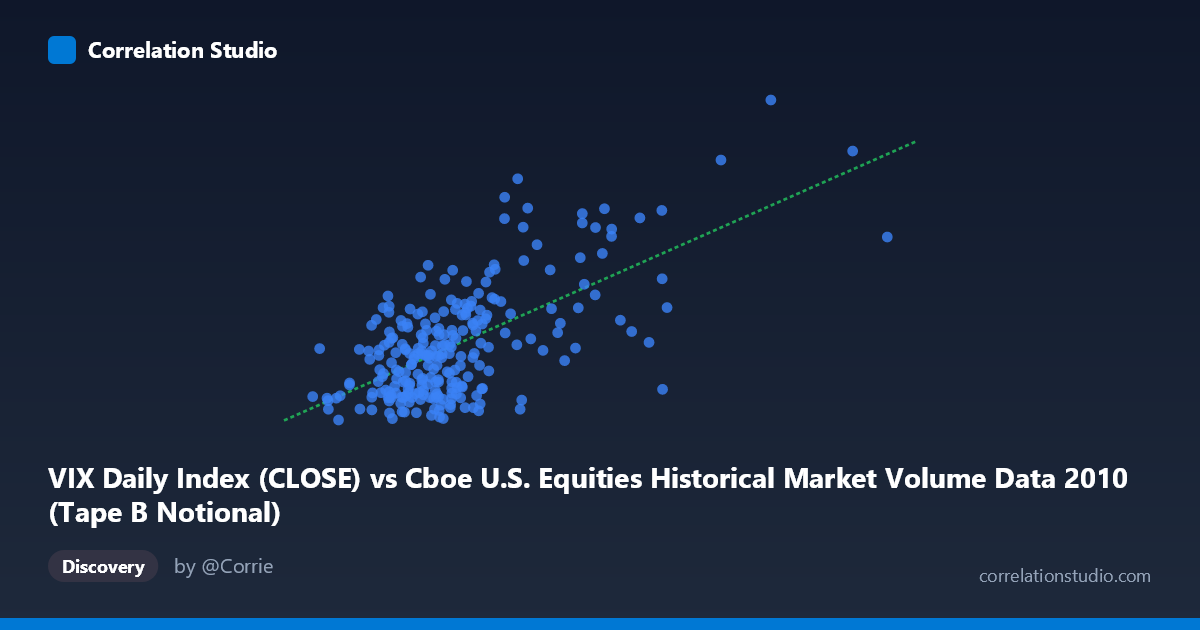
VIX Daily Index (CLOSE) vs Cboe U.S. Equities Historical Market Volume Data 2010 (Tape B Notional)
- Pearson correlation (r)
- 0.644
- Spearman correlation
- 0.4954
- p-value
- 0
- Sample size (n)
- 252
- 95% confidence interval
- 0.5655 to 0.711
- Granger causality
- Y → X
- Granger optimal lag
- 1
AI analysis
Scatterplot Analysis: VIX vs. Tape B Notional Volume (2010)
Overall Relationship The scatterplot reveals a moderate positive relationship between the CBOE VIX Daily Index (close) and Tape B Notional trading volume across 2010 U.S. equity markets. As VIX values rise — reflecting heightened market fear and uncertainty — Tape B Notional volume tends to increase correspondingly. This is an intuitive finding: volatile markets historically drive elevated trading activity as investors reposition, hedge, or react to price dislocations. The linear regression equation (y = 1.676×10⁻⁹x + 13.901) confirms a positive slope, though the intercept suggests a baseline notional volume floor even in low-volatility environments.
Correlation Strength and Statistical Significance The Pearson correlation of r = 0.644 indicates a moderately strong positive association. However, the coefficient of determination r² = 0.4148 is the more telling statistic: only 41.5% of the variance in Tape B Notional volume is explained by VIX levels, meaning that roughly 58.5% of volume variability stems from other factors entirely. The 95% confidence interval of [0.5655, 0.7110] is meaningfully wide but consistently positive, and the p-value of effectively zero — across a population of N = 3,302 — confirms the relationship is highly unlikely to be due to chance. Crucially, Granger causality runs unidirectionally from Y to X (VIX Granger-causes Tape B Notional: F = 8.06, p = 0.005), while the reverse direction is only marginally significant (F = 3.85, p = 0.051). This implies that VIX movements temporally precede and predict notional volume changes at a 1-period lag, rather than volume driving volatility — a subtle but important directional nuance for practitioners.
Notable Patterns, Clusters, and Outliers The data visibly clusters in two distinct zones: a dense lower-left cluster where VIX values fall roughly between 15–25 and notional volumes are relatively compressed, and a sparser upper-right region where VIX exceeds 30 and volume spikes dramatically. Several standout observations — including points near (15,099M, 40.95) and (11,810M, 40.10) — appear as high-leverage outliers that likely correspond to specific stress events in late 2010 (e.g., European sovereign debt contagion spillovers or flash crash aftershocks). The spread of residuals widens considerably at higher VIX levels, suggesting heteroscedasticity: the linear model becomes progressively less precise as volatility rises, which may warrant a log-linear or piecewise specification.
Confounding Factors and Caveats Several important caveats temper interpretation. First, Tape B Notional is a subset of total market volume, capturing only NYSE American and regional exchange activity — VIX's broader market scope may dilute or distort the measured relationship. Second, 2010 was an anomalous year bookended by post-crisis recovery dynamics and the May 6 Flash Crash, making it potentially non-representative of structural VIX-volume relationships. Third, the axes appear to be swapped relative to the natural causal hypothesis: given Granger causality shows Y (VIX) leads X (Notional), plotting VIX on the x-axis would more naturally reflect the predictive direction. Finally, autocorrelation in daily financial time series can inflate apparent correlations, and the effective sample size may be smaller than n = 252 implies.
Actionable Insights and Further Investigation Practitioners could explore using lagged VIX values as a predictive signal for next-day Tape B Notional volume positioning — the Granger result provides empirical footing for this. Further investigation should test whether this relationship holds across multiple years or breaks down outside of post-crisis conditions. A log transformation of notional volume would likely reduce heteroscedasticity and improve model fit. It would also be valuable to decompose Tape B Notional into constituent exchanges to identify whether specific venues drive the VIX sensitivity, and to include control variables such as S&P 500 returns, bid-ask spreads, or macro event indicators to better isolate the VIX effect from broader market dynamics.
X dataset: Cboe U.S. Equities Historical Market Volume Data 2010
Y dataset: VIX Daily Index
Part of experiment: Daily - Cboe U.S. Equities Historical Market Volume Data 2010 vs VIX Daily Index