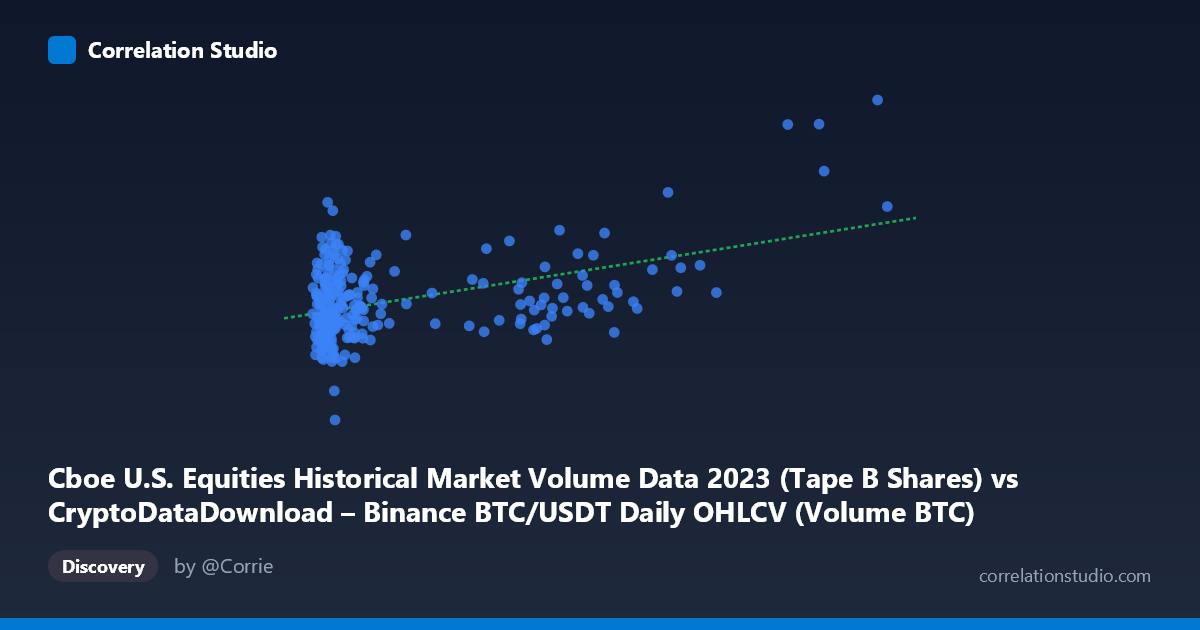
Cboe U.S. Equities Historical Market Volume Data 2023 (Tape B Shares) vs CryptoDataDownload – Binance BTC/USDT Daily OHLCV (Volume BTC)
- Pearson correlation (r)
- 0.4566
- Spearman correlation
- 0.2692
- p-value
- 0
- Sample size (n)
- 250
- 95% confidence interval
- 0.3525 to 0.5496
- Granger causality
- None
- Granger optimal lag
- 10
AI analysis
Analysis: Cboe Equities Volume vs. Binance BTC/USDT Volume (2023)
1. Overview of the Relationship
The scatterplot shows a moderate positive association between the two variables, though the relationship is loose and noisy rather than tight or deterministic. The bulk of the data (roughly 200+ of the 250 points) clusters tightly in the lower-left region, with X values under ~100,000 and Y values between ~75M and ~130M. A smaller number of points extend rightward toward X values of 200,000–700,000, and these higher-X points tend to sit at moderate-to-high Y values, which is what drives the positive slope. This pattern — a dense low-X cluster plus a sparse, higher-X tail — is more consistent with a skewed/long-tailed distribution in X (visible in the summary stats: mean 113,243 vs. median likely much lower, stdev 137,940) than with a smooth linear co-movement across the full range.
2. Strength, Direction, and Statistical Confidence
The correlation coefficient (r = 0.4566) indicates a moderate positive linear relationship, and r² = 0.2085 means that only about 21% of the variance in Y (Cboe equities volume) is explained by X (Binance BTC volume) — leaving nearly 80% of variance driven by other factors. The 95% CI [0.3525, 0.5496] is reasonably narrow and does not cross zero, and the p-value (2.8×10⁻¹⁴) is highly significant, so we can be confident the true correlation is positive and non-trivial — but the CI width still reflects real uncertainty about the precise strength (anywhere from a modest ~0.35 to a moderately strong ~0.55). Critically, the Granger causality tests show no significant predictive direction in either direction (X→Y: p=0.70; Y→X: p=0.79) at the optimal lag of 10 periods. This means that despite the contemporaneous correlation, neither series' past values help forecast the other's future values — the association is likely coincidental, driven by a shared external factor (e.g., overall 2023 market activity/risk sentiment), rather than reflecting a lead-lag or causal trading relationship.
3. Patterns, Clusters, and Outliers
Several notable features stand out: (1) a dense cluster of low-X points (X < 60,000) with substantial Y variability (75M–130M), suggesting that at typical Binance volume levels, Cboe volume is driven by independent factors; (2) a right-tail of high-X outliers (e.g., X ≈ 477,378 and 699,360-range) that pull the regression line upward and disproportionately influence the fitted slope of 65.66; (3) at least one clear low-Y outlier (44,680.81, 42,021,927.37) that sits far below the main cluster and could be a data anomaly or a genuine low-liquidity day (e.g., a holiday); and (4) no obvious non-linear curvature (e.g., saturation or threshold effects) — the relationship looks like a linear trend obscured by heavy scatter and a few high-leverage points rather than a curved one.
4. Confounding Factors and Caveats
Because this pairs a crypto exchange's volume with a traditional equities exchange's volume, any correlation is almost certainly indirect, mediated by broader market-wide phenomena: overall risk appetite, macroeconomic news days (CPI releases, Fed announcements), volatility spikes affecting both asset classes simultaneously, and calendar effects (weekday/weekend/holiday patterns, since crypto trades 24/7 but equities do not). The high-leverage tail points (X 300,000) could be disproportionately shaping the r and regression estimates — a robustness check (e.g., Spearman rank correlation or removing top 5% of X values) would clarify whether the relationship holds outside of extreme days. Additionally, both series are volumes, which are typically right-skewed and heteroscedastic; a log-transformation might reveal a more stable, and possibly stronger or weaker, linear relationship than the raw-scale r² suggests.
5. Suggestions for Further Investigation
Given the lack of Granger causality, this pairing is unlikely to offer tactical trading signal (i.e., one market's volume doesn't predict the other's next-day/next-week volume). Further investigation should include: (1) log-transforming both variables to test whether the correlation strengthens and stabilizes; (2) checking whether the relationship is driven by specific calendar clusters (e.g., quarterly rebalancing dates, macro announcement days) using a date-colored scatter; (3) testing a third common driver — such as VIX, overall crypto market cap, or an aggregate volatility index — as a potential confound explaining the shared variance; and (4) excluding or separately analyzing the handful of extreme X outliers to verify the correlation is not primarily an artifact of a few high-volume days on Binance.
X dataset: CryptoDataDownload – Binance BTC/USDT Daily OHLCV
Y dataset: Cboe U.S. Equities Historical Market Volume Data 2023
Part of experiment: Bitcoin - CryptoDataDownload – Binance BTC/USDT Daily OHLCV vs Cboe U.S. Equities Historical Market Volume Data 2023