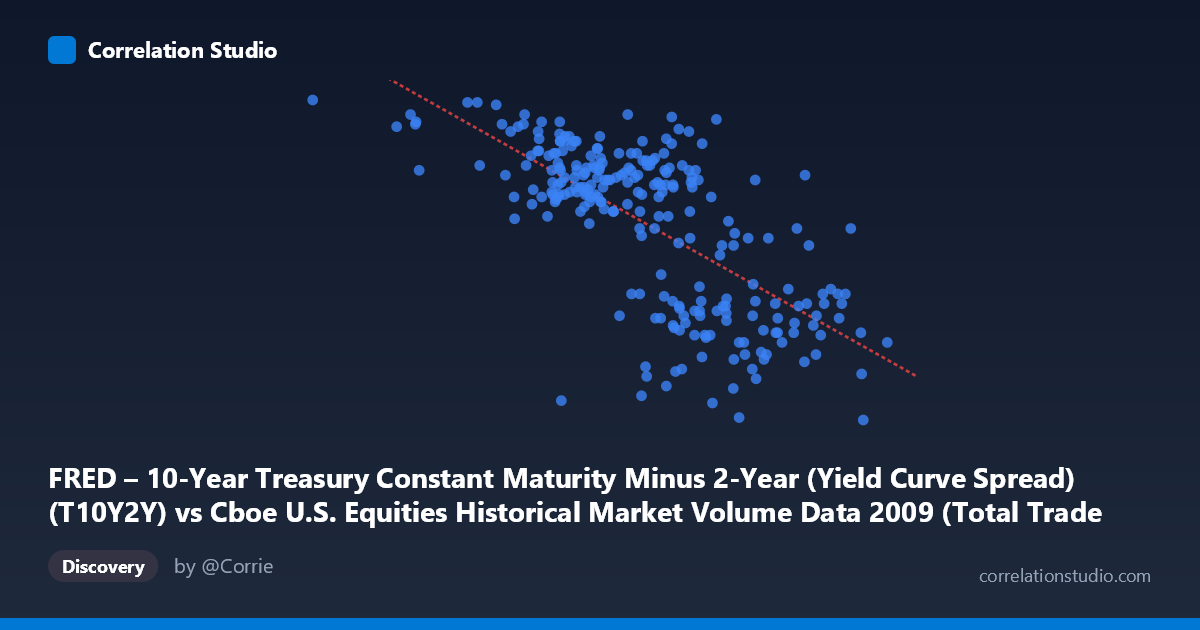
FRED – 10-Year Treasury Constant Maturity Minus 2-Year (Yield Curve Spread) (T10Y2Y) vs Cboe U.S. Equities Historical Market Volume Data 2009 (Total Trade Count)
- Pearson correlation (r)
- -0.6875
- Spearman correlation
- -0.6748
- p-value
- 0
- Sample size (n)
- 250
- 95% confidence interval
- -0.7478 to -0.616
- Granger causality
- None
- Granger optimal lag
- 1
AI analysis
Analysis: Yield Curve Spread vs. U.S. Equity Trade Count (2009)
Relationship Overview
The scatterplot reveals a moderate-to-strong negative relationship between the 10-Year minus 2-Year Treasury yield curve spread and total U.S. equity trade counts throughout 2009. As the yield curve steepened — reflecting growing investor confidence in economic recovery and widening spreads between short and long-term rates — daily equity trade counts tended to decline. This is a somewhat counterintuitive finding at first glance, but it reflects the turbulent market dynamics of 2009, when the post-financial-crisis environment drove both aggressive yield curve steepening and a gradual normalization (reduction) of the panic-driven, ultra-high trading volumes seen during the crisis period. The linear regression equation (y = -3.81e⁻⁷x + 3.325) confirms the negative slope, suggesting each unit increase in spread corresponds to meaningfully lower trade activity.
Correlation Strength and Statistical Significance
The correlation coefficient of r = -0.6875 indicates a moderately strong negative association, and the R² of 0.4727 means the yield curve spread explains approximately 47.3% of the variance in daily trade counts — a substantial explanatory share for a single macroeconomic variable against a market microstructure metric. The 95% confidence interval of [-0.748, -0.616] is relatively tight and does not cross zero, lending strong confidence that the negative relationship is real and consistent. The p-value of ~0 (for n = 250 drawn from N = 3,232) confirms this correlation is highly unlikely to be a statistical artifact. However, the Granger causality results tell a more nuanced story: neither direction of temporal predictability reaches significance (X→Y: F = 1.70, p = 0.193; Y→X: F = 0.033, p = 0.855). This means that while the contemporaneous correlation is robust, neither variable reliably predicts the other in advance at a one-period lag — the relationship is associative rather than directionally predictive in time.
Patterns, Clusters, and Outliers
Several notable structural features are visible in the sample data. There is a discernible clustering of high trade counts (Y ≈ 2.4–2.8) at lower spread values (X ≈ 600K–2.2M), consistent with early 2009 when crisis-era volatility kept both spreads compressed and trading volumes elevated. Conversely, lower trade counts (Y ≈ 1.6–2.0) concentrate at higher spread values (X ≈ 2.8M–4.1M), reflecting later in 2009 as markets calmed and volumes normalized. The extreme point at (629,671, 2.82) stands out as a potential outlier — the lowest spread in the dataset paired with one of the highest trade counts — likely representing a specific early-crisis day with extreme activity. Similarly, (4,134,003, 1.82) anchors the opposite extreme. The relationship also shows increased variance (heteroscedasticity) at intermediate spread values, suggesting the relationship is not uniformly linear across the full range.
Confounding Factors and Caveats
Several important caveats warrant caution. First, 2009 is a highly unusual year — markets transitioned from post-Lehman crisis lows in March to a sustained recovery rally, meaning both variables were simultaneously driven by the same underlying macro regime shift (risk-off to risk-on), which could be inflating the apparent correlation through a common cause rather than a direct mechanism. Second, equity trade volume is influenced by many factors beyond yield spreads, including VIX levels, Fed policy announcements, earnings seasons, and algorithmic trading dynamics — the remaining ~53% unexplained variance likely captures these. Third, the axis labels appear to be swapped in the dataset metadata (X is described as T10Y2Y but sourced from the equity volume dataset, and vice versa), which may reflect a data joining quirk and should be verified before drawing causal inference. Finally, the lack of Granger causality suggests we should be especially careful not to interpret this as a trading signal.
Actionable Insights and Further Investigation
Despite the caveats, the strength of this relationship justifies further investigation. A natural next step would be to extend the analysis beyond 2009 to test whether the negative yield-curve-to-volume relationship holds across multiple market regimes, particularly around other yield curve inversions (e.g., 2006–2007, 2019, 2022–2023). Analysts should also control for VIX and realized volatility as mediating variables, since both trade volume and yield spreads respond to market uncertainty — a multivariate regression could isolate the independent contribution of the yield curve. Additionally, examining non-linear models (e.g., segmented regression or GAMs) could better capture the apparent heteroscedasticity at mid-range spreads. Finally, given the Granger non-result, intraday or weekly aggregation at different lags might reveal predictive dynamics not visible at the daily one-period lag tested here.
X dataset: Cboe U.S. Equities Historical Market Volume Data 2009
Y dataset: FRED – 10-Year Treasury Constant Maturity Minus 2-Year (Yield Curve Spread)
Part of experiment: Daily - Cboe U.S. Equities Historical Market Volume Data 2009 vs FRED – 10-Year Treasury Constant Maturity Minus 2-Year (Yield Curve Spread)