NOAA ISD Weather Station History (Lat/Lon Index) (SLP_ATTRIBUTES) vs CryptoDataDownload – Binance BTC/USDT Daily OHLCV (Low)
- Pearson correlation (r)
- -0.4768
- Spearman correlation
- -0.3268
- p-value
- 0
- Sample size (n)
- 355
- 95% confidence interval
- -0.5534 to -0.3921
- Granger causality
- None
- Granger optimal lag
- 1
AI analysis
Analysis: Correlation Between Weather Station Attributes and BTC/USDT Trading Data
1. What the Visualization Reveals
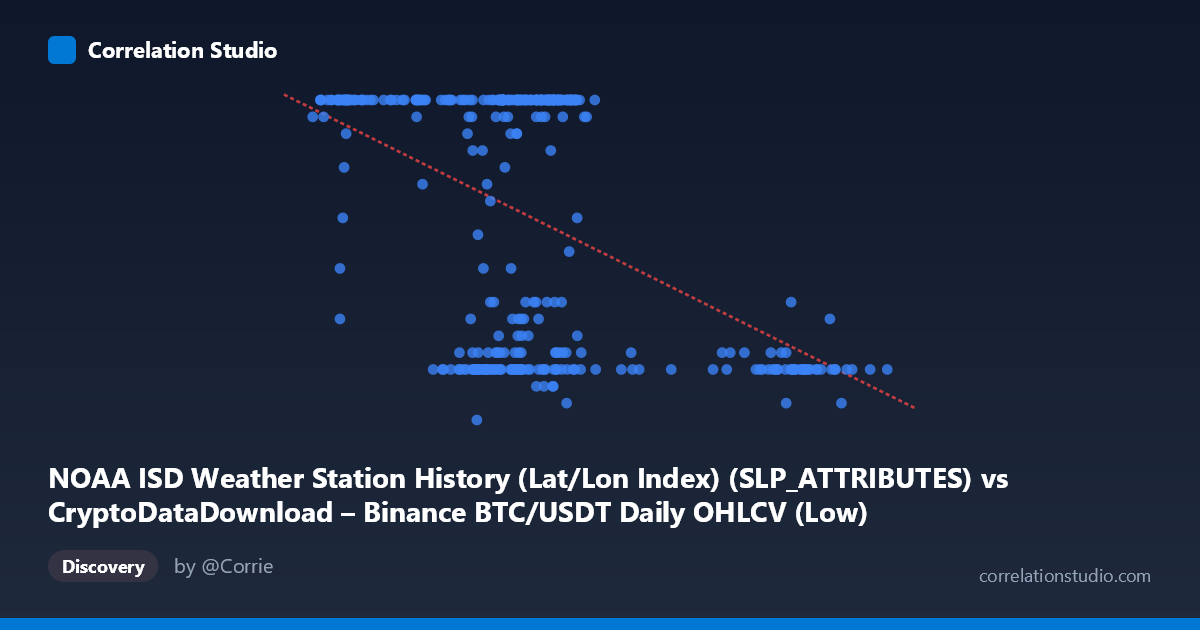
This scatterplot is comparing two variables that are, on their face, unrelated: an X-axis column labeled as weather station SLP attributes but described as BTC/USDT OHLCV data, and a Y-axis column labeled as BTC/USDT "Low" price but sourced from NOAA weather station records. This metadata mismatch strongly suggests a data pipeline or column-mapping error rather than a genuine economic or physical relationship. The visualization itself shows a loose negative-sloping cloud of points, with X values clustered tightly between ~40,000–70,000 and a long right tail extending to ~105,000, while Y values are clustered heavily at specific integer levels (especially 8, 9, and 24), suggesting Y is a discretized or categorical-like variable rather than a continuous price.
2. Strength, Direction, and Statistical Uncertainty
The correlation coefficient (r = -0.4768, R² = 0.227) indicates a moderate negative linear relationship, but one that explains less than a quarter of the variance in Y — meaning roughly 77% of Y's variability is driven by factors outside this X variable. The 95% confidence interval [-0.553, -0.392] is reasonably tight and excludes zero, and the p-value of ~0 confirms this correlation is statistically significant and not due to chance, given the large sample (n=355). However, statistical significance here should not be conflated with practical or causal importance — a moderate r with low R² means X is a weak-to-moderate predictor at best. The Granger causality tests reinforce this: neither direction (X→Y: p=0.66; Y→X: p=0.26) shows significant predictive power, indicating no evidence of temporal lead-lag relationship between these series at lag 1. This is consistent with the two variables being either unrelated or improperly aligned/mismatched in the pipeline.
3. Notable Patterns and Structure
The data shows clear banding/clustering in Y at values like 24 (very dense), 8-9, and other integers, which is unusual for a continuous price variable like "Low" — this looks more like a bucketed, categorical, or index-like variable (consistent with the "SLPATTRIBUTES" label, which in NOAA data is typically a categorical quality/attribute flag, not a continuous temperature or pressure reading). Meanwhile, X shows a dense core between 55,000–70,000 with sparse outliers near 90,000–105,000 that mostly pair with low Y values (8-9), creating the visual impression of a negative slope that may be driven disproportionately by a handful of high-X outlier points rather than a smooth overall trend.
4. Confounding Factors and Caveats
The most serious caveat is the apparent metadata inconsistency — the column descriptions swap NOAA weather data and crypto OHLCV data, meaning it's unclear what is actually being plotted. If this is a labeling artifact, the "correlation" may be spurious or an artifact of how each dataset was indexed/joined (e.g., merged by row order or date without proper alignment). Additionally, if Y is truly a categorical attribute code, Pearson correlation and linear regression are not appropriate for a variable that isn't continuous. Outliers in the X tail (values 90,000) also warrant scrutiny — a robustness check should be run excluding these points.
5. Recommended Next Steps
1. Audit the data pipeline to confirm which actual columns are being plotted — resolve the label mismatch before drawing any further conclusions. 2. Check Y's data type — if it's categorical/discrete (attribute codes), use appropriate methods (e.g., ANOVA, chi-square, or ordinal correlation) instead of Pearson r and linear regression. 3. Test robustness by removing the small cluster of high-X outliers (85,000) to see if the correlation holds or collapses. 4. Verify date/time alignment between the two source datasets, since a join error (e.g., mismatched timestamps between crypto daily data and weather station daily data) could easily produce a spurious moderate correlation like this one.
X dataset: CryptoDataDownload – Binance BTC/USDT Daily OHLCV
Y dataset: NOAA ISD Weather Station History (Lat/Lon Index)
Part of experiment: Bitcoin - CryptoDataDownload – Binance BTC/USDT Daily OHLCV vs NOAA ISD Weather Station History (Lat/Lon Index)