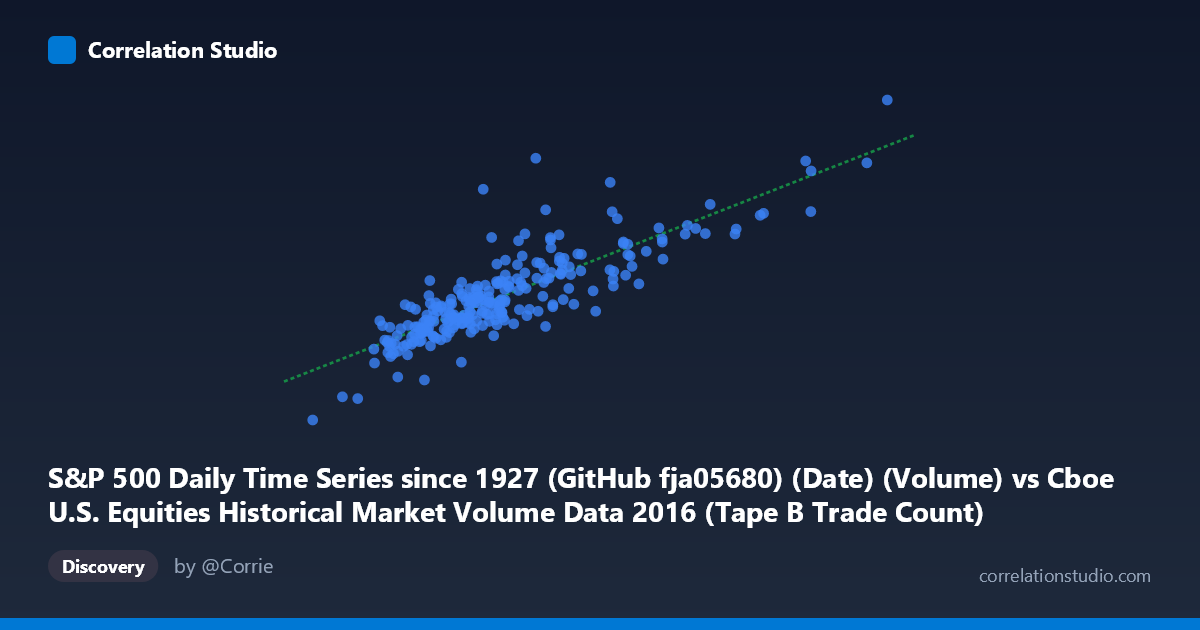
S&P 500 Daily Time Series since 1927 (GitHub fja05680) (Date) (Volume) vs Cboe U.S. Equities Historical Market Volume Data 2016 (Tape B Trade Count)
- Pearson correlation (r)
- 0.8458
- Spearman correlation
- 0.8415
- p-value
- 0
- Sample size (n)
- 252
- 95% confidence interval
- 0.8065 to 0.8776
- Granger causality
- None
- Granger optimal lag
- 10
AI analysis
Analysis: S&P 500 Daily Volume vs. Cboe Tape B Trade Count (2016)
Relationship Overview The scatterplot reveals a strong positive linear relationship between S&P 500 daily trading volume and Cboe Tape B trade count across 252 trading days in 2016. As daily volume increases, Tape B trade count rises consistently, following the regression line y = 7,174.31x + 1.614×10⁹ quite closely across most of the data range. This relationship is intuitive: both metrics fundamentally measure market activity, and days characterized by elevated participation naturally drive up transaction counts across exchange tapes simultaneously.
Correlation Strength and Statistical Significance The correlation is strong (r = 0.846), with r² = 0.715 indicating that 71.5% of the variance in Tape B trade count is explained by S&P 500 volume — a substantial but incomplete explanatory relationship. The 95% confidence interval [0.807, 0.878] is relatively narrow, reflecting the adequacy of the n=252 sample, and the p-value of effectively zero confirms this is not a chance finding. However, the Granger causality results are notably absent in both directions (X→Y: F=0.78, p=0.65; Y→X: F=0.63, p=0.79), meaning neither series reliably predicts the other temporally at the optimal 10-period lag. This is a critical nuance: while the contemporaneous correlation is strong, neither variable meaningfully leads the other, suggesting they respond to common driving forces simultaneously rather than sequentially.
Notable Patterns and Outliers The bulk of observations cluster between roughly 200,000–400,000 in volume and 3.0–4.5 billion in trade count, forming a dense, well-behaved linear core. However, several notable outliers exist in the upper-right region — points near volumes of 450,000–560,000 with trade counts approaching 5.0–5.1 billion — which appear to deviate slightly above the regression line, suggesting disproportionately elevated trade fragmentation on high-volume days. A few lower-left points (e.g., volume ~189,000, trade count ~2.65 billion) also anchor the relationship at the low end. The remaining ~28.5% of unexplained variance likely manifests as the visible vertical scatter around the regression line.
Confounding Factors and Caveats Several important caveats warrant caution. First, both variables are essentially co-measures of market activity, making the high correlation partially tautological — they share common upstream drivers (volatility events, macro announcements, earnings seasons) rather than having an independent causal link. Second, the dataset covers only one calendar year (2016), which includes idiosyncratic events like the U.S. presidential election and Brexit aftermath, potentially inflating the apparent strength of the relationship versus a multi-year baseline. Third, Tape B specifically covers NYSE American and regional exchange securities, so the relationship may be influenced by compositional shifts in which securities dominate volume on any given day. Finally, the N=3,622 population context versus n=252 sample suggests the full population dynamics may differ from this single-year window.
Actionable Insights and Further Investigation Practitioners monitoring market microstructure could use this relationship as a real-time cross-validation signal — significant divergences between volume and Tape B trade count may indicate unusual fragmentation or routing anomalies worth investigating. For further research, it would be valuable to: (1) extend the analysis across multiple years to assess whether r² stability holds across different volatility regimes; (2) decompose residuals by market event type (FOMC days, earnings peaks) to identify when the relationship breaks down; (3) compare Tape A and Tape C trade counts against the same volume metric to assess whether Tape B's relationship is representative or idiosyncratic; and (4) investigate the upper-right outlier cluster to determine whether specific structural factors — such as high-frequency trading surges or index rebalancing events — systematically push trade counts above model expectations on the highest-volume days.
X dataset: Cboe U.S. Equities Historical Market Volume Data 2016
Y dataset: S&P 500 Daily Time Series since 1927 (GitHub fja05680) (Date)
Part of experiment: Daily - Cboe U.S. Equities Historical Market Volume Data 2016 vs S&P 500 Daily Time Series since 1927 (GitHub fja05680) (Date)