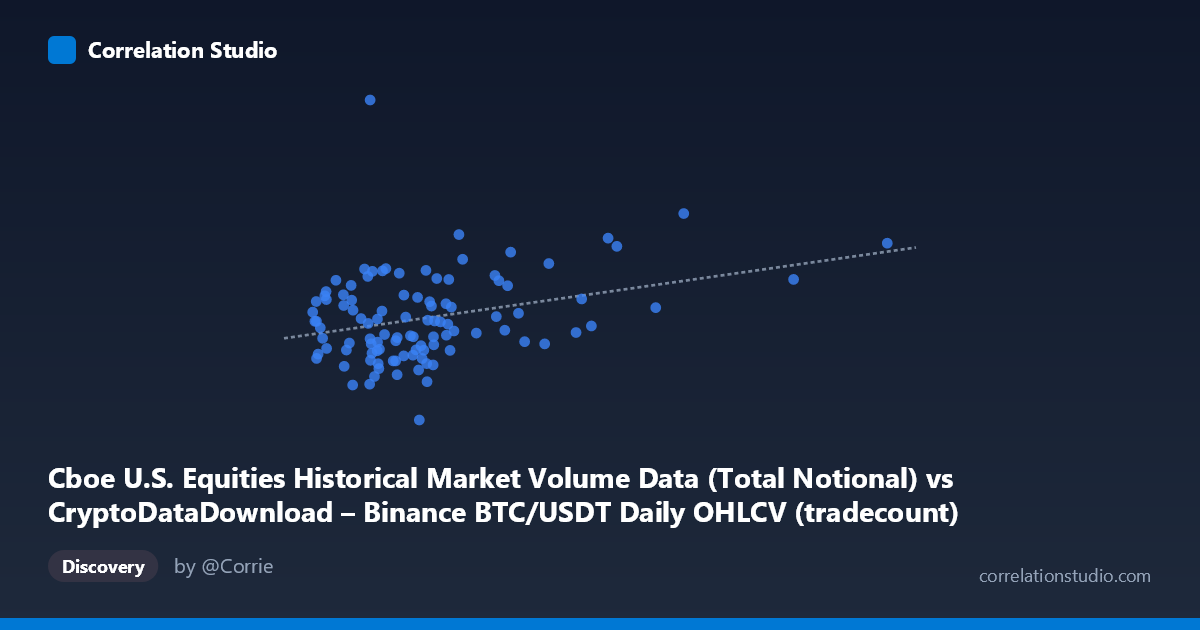
Cboe U.S. Equities Historical Market Volume Data (Total Notional) vs CryptoDataDownload – Binance BTC/USDT Daily OHLCV (tradecount)
- Pearson correlation (r)
- 0.3168
- Spearman correlation
- 0.2294
- p-value
- 0.00105
- Sample size (n)
- 104
- 95% confidence interval
- 0.1323 to 0.4801
- Granger causality
- None
- Granger optimal lag
- 10
AI analysis
Analysis: Cboe Equities Volume vs. Binance BTC/USDT Trade Count
1. Relationship Overview
The scatterplot shows a positive, moderately noisy relationship between the two variables: as the X-axis metric (Cboe notional volume) increases, the Y-axis metric (BTC/USDT tradecount) tends to rise as well. However, the cloud of points is wide and diffuse rather than tightly clustered around the regression line, indicating a real but weak-to-moderate linear association rather than a tight predictive relationship. Most observations sit in a dense band between X = 2.3M–6M with Y = 40B–60B, with a thinner tail of higher-X points extending out to 15M that pull the trend line upward.
2. Strength, Direction, and Statistical Confidence
The correlation coefficient (r = 0.4867) indicates a moderate positive linear relationship, but r² = 0.2369 tells the more important story: only about 23.7% of the variance in Y is explained by X, leaving over three-quarters of the variability attributable to other factors or noise. The 95% CI [0.311, 0.630] is reasonably wide but does not cross zero, and the p-value (1.15E-06) confirms the correlation is statistically significant and unlikely due to chance in this sample. That said, statistical significance here reflects a real but modest linear tendency, not a strong deterministic relationship — practically, X is a weak-to-moderate predictor of Y at best. The Granger causality tests reinforce this: neither direction is significant at conventional thresholds (X→Y: p = 0.0546, borderline; Y→X: p = 0.3514, clearly not significant), meaning there is no robust evidence that past values of one variable help forecast the other over time. The X→Y result sits right at the edge of significance and deserves a cautious "maybe" rather than a firm causal claim.
3. Patterns, Clusters, and Outliers
The bulk of the data clusters in the lower-X range (roughly 2M–6M), consistent with the mean (~4.95M) and stdev (~2.31M) — this region shows considerable vertical scatter in Y, spanning nearly the full 40B–60B range, suggesting X has limited explanatory power in this dense zone. A smaller number of high-leverage points (X 9M, up to 15.36M) appear to anchor the upward slope; without these points, the correlation would likely be much weaker, meaning the reported r² may be overly reliant on a handful of extreme observations. There's also a visible low outlier (Y ≈ 34.02B, near X ≈ 4.7M) that sits well below the main cluster and may be worth investigating as a data anomaly or a genuine low-activity day.
4. Confounding Factors and Caveats
These two series come from entirely different markets (traditional U.S. equities trading volume vs. Binance crypto trade counts) and are likely both driven by a common latent factor — overall market-wide risk appetite, macro volatility, or trading activity cycles — rather than a direct causal link between equities notional volume and crypto trade counts. Time-based confounding is also likely: both series may share trends, seasonality, or event-driven spikes (e.g., macro news, Fed announcements, crypto-specific events) that inflate correlation without genuine dependency. Additionally, n = 90 is a modest sample relative to the full population (N = 1,980), and the daily/temporal alignment between a U.S. equities session and 24/7 crypto trading introduces potential timing mismatches (time zone, trading hours) that could dilute or distort the true relationship.
5. Recommendations for Further Investigation
Given the weak Granger causality signal and modest r², treat this correlation as suggestive of shared macro drivers rather than a tradable causal signal. Next steps should include: (a) testing with a larger sample (closer to the full N = 1,980) to see if the borderline X→Y Granger result strengthens or resolves; (b) checking for common third-factor drivers such as VIX, overall crypto market cap, or macro liquidity conditions that might explain co-movement; (c) applying robust/non-linear correlation measures (e.g., Spearman, or segmented regression) to test whether the high-X tail is disproportionately driving the linear fit; and (d) investigating the low-Y outlier and any data quality issues around date alignment or timezone conventions between the Cboe and Binance datasets before drawing further conclusions.
X dataset: CryptoDataDownload – Binance BTC/USDT Daily OHLCV
Y dataset: Cboe U.S. Equities Historical Market Volume Data
Part of experiment: Bitcoin - CryptoDataDownload – Binance BTC/USDT Daily OHLCV vs Cboe U.S. Equities Historical Market Volume Data