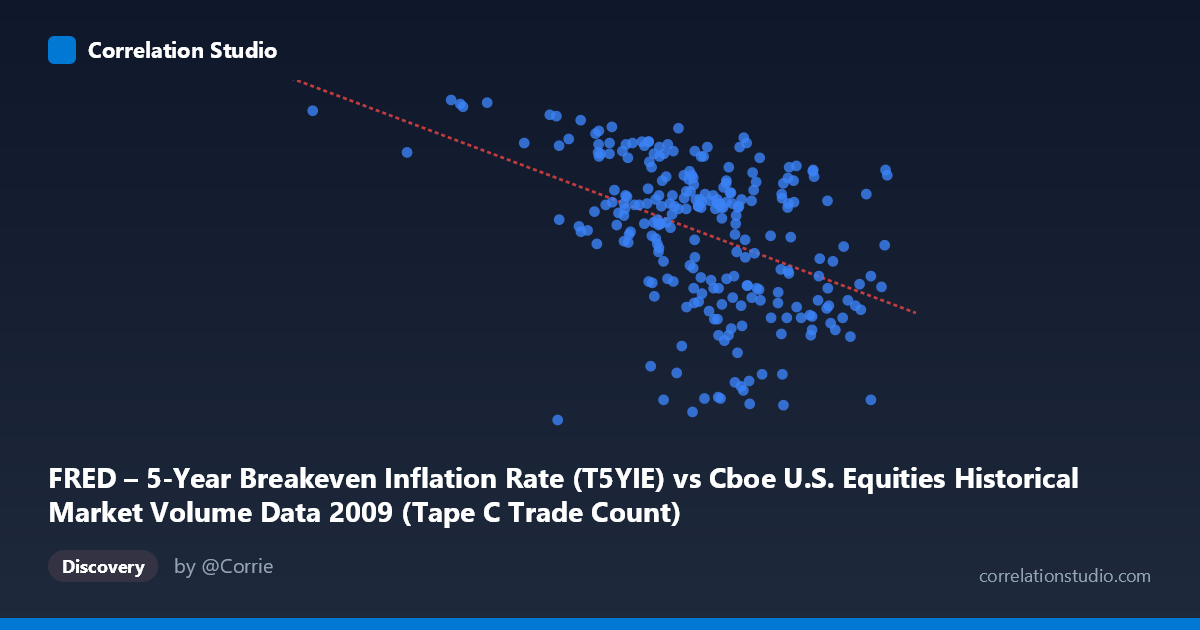
FRED – 5-Year Breakeven Inflation Rate (T5YIE) vs Cboe U.S. Equities Historical Market Volume Data 2009 (Tape C Trade Count)
- Pearson correlation (r)
- -0.4458
- Spearman correlation
- -0.437
- p-value
- 0
- Sample size (n)
- 250
- 95% confidence interval
- -0.54 to -0.3406
- Granger causality
- None
- Granger optimal lag
- 1
AI analysis
Scatterplot Analysis: 5-Year Breakeven Inflation Rate vs. Cboe Tape C Trade Count (2009)
Relationship Overview
The scatterplot reveals a moderate negative relationship between the FRED 5-Year Breakeven Inflation Rate (T5YIE) on the X-axis and the Cboe U.S. Equities Tape C Trade Count on the Y-axis across the 2009 trading year. The linear regression equation (y = -2.4234E-06x + 2.68228) indicates that as market volume/trade counts increase, inflation expectations tend to be lower, and vice versa. Visually, the data cloud slopes downward from left to right, with higher trade counts (Y values near 1.5–2.1) clustering at lower X values and lower trade counts (near 0–0.8) appearing more frequently at higher X values. This pattern is broadly consistent throughout the sample, though with considerable scatter around the regression line.
Correlation Strength and Statistical Significance
The Pearson correlation of r = -0.4458 reflects a moderate negative association, but the variance explained metric tells a more measured story: r² = 0.1988, meaning only about 19.9% of the variance in inflation breakeven rates is accounted for by trade count levels. The remaining ~80% of variation is attributable to other factors entirely. The 95% confidence interval of [-0.54, -0.34] is notably narrow, and the p-value of 1.303E-13 confirms this correlation is highly statistically significant given the large population (N = 3,232) — ruling out chance as an explanation. However, the Granger causality results complicate the interpretation substantially: neither direction (X→Y: F = 0.3132, p = 0.576; Y→X: F = 0.4516, p = 0.502) reaches significance at even modest thresholds. This means that despite a reliable contemporaneous correlation, neither variable temporally predicts the other at a one-period lag, undermining any causal narrative.
Notable Patterns, Clusters, and Outliers
Several features stand out in the data. There is a visible cluster of high-Y, low-X observations — particularly notable are points like (185886.83, 2.05), (387119.00, 2.11), (470022.85, 1.79), and (466902.92, 2.01), which represent very low trade count volumes paired with high inflation expectations. These are likely early-2009 observations, when markets were in crisis-recovery mode and inflation expectations were recovering from deeply negative territory following the 2008 financial collapse. Conversely, the high-X, low-Y cluster (e.g., 797111.31, 0.51; 806023.15, 0.37; 760363.77, 0.38) represents periods of elevated trading activity coinciding with subdued inflation expectations — possibly mid-to-late 2009 as equity volatility remained high. One potential outlier, (653554.08, -0.08), shows a slightly negative inflation breakeven rate, reflecting lingering deflationary fears during this period.
Confounding Factors and Interpretive Caveats
The most significant caveat is the temporal structure of 2009 itself: this was an extraordinarily anomalous year bookended by crisis conditions in January and a strong recovery rally by year-end. Both variables were simultaneously driven by the macro shock of the financial crisis and its resolution — meaning the correlation likely reflects a common response to a third factor (systemic financial stress) rather than any direct mechanistic link between trade counts and inflation expectations. Additionally, the axis labels appear to be swapped in the metadata (the X-axis dataset description references Cboe volume data while Y-axis references FRED inflation data, yet the column assignments suggest the reverse), which warrants verification before drawing firm conclusions. The 19.9% explained variance also confirms that the bulk of inflation expectation dynamics are driven by factors entirely outside equity market volume metrics.
Actionable Insights and Further Investigation
Given the absence of Granger causality, practitioners should avoid using trade volume as a leading indicator for inflation expectations or vice versa in any near-term forecasting framework. However, the contemporaneous correlation does suggest these variables share meaningful exposure to common macro risk drivers — making it worth investigating whether VIX, credit spreads, or Fed policy announcements serve as the underlying confound linking them. A natural next step would be to extend the analysis across multiple years (2007–2012) to determine whether this negative correlation is specific to the crisis period or persists in calmer market regimes. Researchers might also consider a regime-switching model or rolling-window correlation analysis to test whether the r = -0.45 relationship strengthens during high-volatility episodes — which would lend support to the systemic stress hypothesis and potentially identify more actionable signals for cross-asset risk monitoring.
X dataset: Cboe U.S. Equities Historical Market Volume Data 2009
Y dataset: FRED – 5-Year Breakeven Inflation Rate
Part of experiment: Daily - Cboe U.S. Equities Historical Market Volume Data 2009 vs FRED – 5-Year Breakeven Inflation Rate