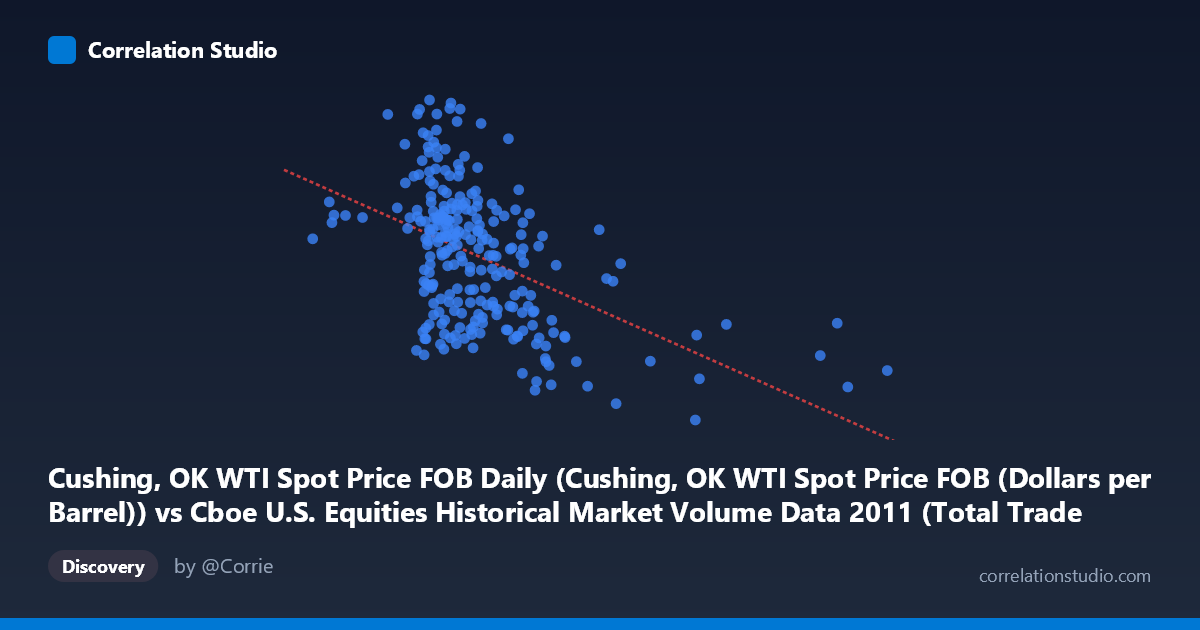
Cushing, OK WTI Spot Price FOB Daily (Cushing, OK WTI Spot Price FOB (Dollars per Barrel)) vs Cboe U.S. Equities Historical Market Volume Data 2011 (Total Trade Count)
- Pearson correlation (r)
- -0.4855
- Spearman correlation
- -0.4683
- p-value
- 0
- Sample size (n)
- 252
- 95% confidence interval
- -0.5746 to -0.3851
- Granger causality
- Y → X
- Granger optimal lag
- 1
AI analysis
Analysis: WTI Crude Oil Price vs. U.S. Equities Trade Count (2011)
Relationship Overview The scatterplot reveals a moderate negative relationship between WTI crude oil spot prices (X-axis) and U.S. equities total trade count (Y-axis) across 252 trading days in 2011. As oil prices rise, equity market trade counts tend to decline, and vice versa. The linear regression equation (y = -7.32×10⁻⁶x + 109.697) confirms this inverse slope, though the scatter around the regression line is substantial, indicating that oil price alone is far from a complete explanation of daily trading activity. The data spans a meaningful range — oil prices from roughly $75 to $113 per barrel, and trade counts from approximately 75 to 113 (in appropriate units) — suggesting the relationship is observed across genuinely varied market conditions throughout the year.
Correlation Strength, Direction, and Causality The correlation coefficient of r = -0.4855 indicates a moderate negative association, but the more informative metric is R² = 0.2357, meaning WTI oil prices explain only 23.6% of the variance in equity trade counts. The remaining ~76% is attributable to other factors entirely. The 95% confidence interval for r of [-0.5746, -0.3851] is meaningfully narrow and does not cross zero, and the p-value of 2.22×10⁻¹⁶ confirms this correlation is statistically indistinguishable from chance at any conventional threshold — with N = 3,780 underlying observations, this result is robust. Critically, the Granger causality analysis provides important directional nuance: Y Granger-causes X (F = 3.98, p = 0.047) at a one-period lag, while the reverse direction (X→Y) shows no predictive power (F = 0.005, p = 0.944). This means equity trade volume levels have modest short-term predictive power over subsequent oil prices, but oil prices do not reliably predict next-period trading activity — a somewhat counterintuitive finding that challenges a simple "oil price drives market behavior" narrative.
Patterns, Clusters, and Outliers The scatterplot exhibits notable heterogeneity across the X range. The bulk of observations cluster between oil prices of roughly $1.6M–$2.2M (in the X units shown, likely reflecting aggregated notional values), with trade counts concentrated in the 88–108 range. Several potential outliers are visible: points at very high X values (above $3.5M, e.g., the point near 3,603,943 with a trade count of ~85.5) sit at the lower end of trade counts, consistent with the negative trend but relatively isolated. At the lower X extreme (~$954K), trade counts remain moderate (~101), suggesting the relationship may not be strictly linear at the tails. There is also visible vertical spread at any given X value — for instance, at X ≈ $1.7–1.9M, trade counts range widely from ~85 to ~109 — reinforcing that the correlation, while real, leaves enormous unexplained variability.
Confounding Factors and Caveats Several important caveats apply. First, the axis labels appear swapped in the dataset metadata (the X dataset is described as Cboe volume data while the Y dataset is described as WTI price data), which could reflect a data pipeline labeling issue and warrants verification before drawing conclusions. Second, 2011 was an unusually volatile year — marked by the Arab Spring, European sovereign debt crisis, U.S. debt ceiling debates, and the Fukushima disaster — meaning macroeconomic events likely drove both variables simultaneously, creating spurious or confounded correlation rather than a direct causal link. Third, equity trade counts are influenced by algorithmic trading volumes, exchange competition, and regulatory changes that are entirely independent of oil markets. Fourth, the Granger causality result, while statistically significant, uses only a one-period lag and explains a modest incremental effect; it should not be over-interpreted as strong economic causation.
Actionable Insights and Further Investigation Practitioners should resist using WTI prices as a direct trading volume predictor given that only ~24% of variance is explained. However, the statistically significant Granger result suggesting trade count predicts next-period oil prices warrants further investigation — potentially as one signal among many in an oil price forecasting model. It would be valuable to: (1) test whether the negative correlation holds across other years or is specific to 2011's volatility regime; (2) decompose trade count by exchange or asset class to identify which market segments drive the relationship; (3) introduce control variables such as VIX (volatility index), S&P 500 returns, and dollar index to isolate the oil price effect; and (4) apply non-linear modeling (e.g., regime-switching or quantile regression) given the visible heteroscedasticity in the scatterplot. The Granger causality direction also suggests exploring whether elevated trading activity serves as a leading indicator of commodity market stress.
X dataset: Cboe U.S. Equities Historical Market Volume Data 2011
Y dataset: Cushing, OK WTI Spot Price FOB Daily
Part of experiment: Daily - Cboe U.S. Equities Historical Market Volume Data 2011 vs Cushing, OK WTI Spot Price FOB Daily