US Measles cases and deaths historical (Measles deaths) vs US Employment and Unemployment (not_in_labor)
- Pearson correlation (r)
- -0.6665
- Spearman correlation
- -0.925
- p-value
- 0
- Sample size (n)
- 74
- 95% confidence interval
- -0.7767 to -0.5167
- Granger causality
- Y → X
- Granger optimal lag
- 10
- Time coverage
- 1949-01-01 to 2022-01-01
- Recomputed on refreshed data
- 2026-10-17 (r was -0.6665)
AI analysis
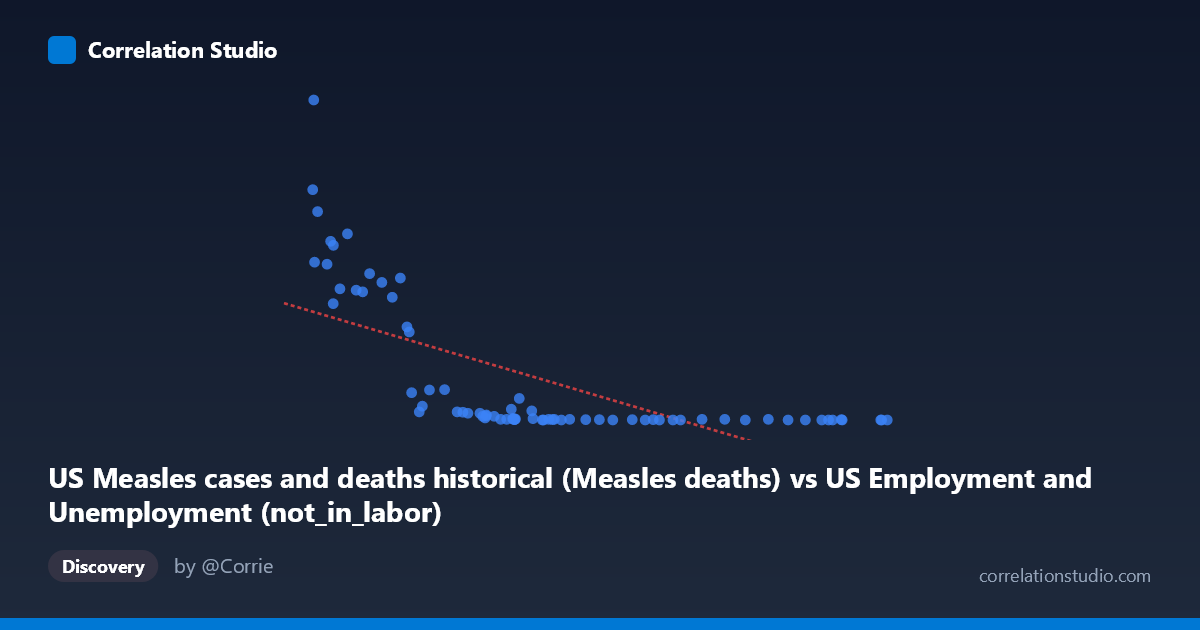
Scatterplot Analysis: Measles Deaths vs. Not-in-Labor-Force
1. What the Visualization Reveals
The scatterplot displays a striking inverse relationship between US Measles deaths (X-axis) and the number of Americans not in the labor force (Y-axis) across roughly seven decades (1949–2022). The pattern is immediately recognizable: as measles deaths were high (concentrated in the lower X range, roughly 42,000–55,000), the not-in-labor-force population was also high (200–950 units), while as measles deaths declined toward zero, the not-in-labor-force count collapses toward zero as well — though the clustering at the right end of the X-axis near zero deaths is dense and flat. The linear regression (y = -0.00873x + 693.25) captures a downward slope, but the data distribution strongly hints at a non-linear, possibly logarithmic or exponential decay curve rather than a simple linear fit.
2. Correlation Strength, Direction, and Causality
The Pearson correlation of r = -0.667 indicates a moderate-to-strong negative association, with r² = 0.444 meaning approximately 44.4% of variance in the not-in-labor-force variable is statistically explained by measles deaths. While this is a non-trivial proportion, it equally means 55.6% of variance remains unexplained, warranting caution. The 95% confidence interval of [-0.777, -0.517] is entirely negative and reasonably tight, and the p-value of 9.0 × 10⁻¹¹ is extraordinarily small, confirming the association is statistically robust and not a sampling artifact. Critically, the Granger causality analysis reveals a unidirectional relationship: Y Granger-causes X (F = 2.41, p = 0.022) at a 10-period lag, meaning past values of the not-in-labor-force count have marginal predictive power over measles deaths — but not the reverse (X→Y: F = 1.35, p = 0.234). This counterintuitive directionality strongly signals that neither variable is mechanistically driving the other, and both are being swept along by a common historical tide.
3. Notable Patterns, Clusters, and Non-Linearity
Several structural features stand out. First, there is a dense cluster near (60,000–100,000 deaths, 0–30 Y-values) representing the post-vaccine era (roughly post-1963) where measles deaths plummeted and the not-in-labor-force measure also flattened. Second, the high-leverage outliers — particularly (42,708, 949), (42,604, 683), and (43,093, 618) — correspond to early years with catastrophically high measles mortality and a distinctly different labor-force demographic landscape. Third, the Spearman ρ exceeding Pearson r explicitly flags a non-linear relationship, suggesting a logarithmic or power-law curve would fit substantially better. The data essentially describes two regimes: a pre-vaccine era with high measles deaths and high not-in-labor-force counts, and a post-vaccine era where both metrics compress toward negligible values — a regime shift rather than a smooth continuum.
4. Confounding Factors and Caveats
This correlation is almost certainly spurious, driven by shared temporal trends rather than any causal mechanism. Both variables are time-indexed annual series that declined dramatically over the 20th century for entirely independent reasons: measles deaths collapsed due to the introduction of the measles vaccine in 1963, while the not-in-labor-force population fluctuated due to demographic shifts (baby boom, women entering the workforce, aging population, retirement trends). This is a classic case of two time series co-trending, producing an inflated correlation coefficient. The Granger "causality" result, while statistically present, likely reflects shared autocorrelation structure rather than genuine predictive information. Additionally, the dataset mismatch — measles data sourced from public health records paired with BLS labor statistics — and the suspicious column-to-dataset assignment (each variable appears to come from the other dataset's file) raises data-provenance concerns that should be resolved before interpretation.
5. Actionable Insights and Further Investigation
Researchers should detrend both time series (e.g., via first-differencing or HP filtering) before re-computing correlation, as this would likely reduce r dramatically and expose the spurious nature of the association. A structural break test around 1963 (vaccine introduction) and around major labor-force demographic shifts (1970s women's labor participation surge) would clarify whether the correlation is regime-dependent. Fitting a logarithmic or segmented regression model is warranted given the Spearman Pearson signal. If the goal is understanding labor-force participation, genuine predictors — GDP growth, education rates, demographic age structure — should be incorporated in a multivariate model. Finally, the Granger causality finding at a 10-period lag deserves replication with proper controls for common trends, as the current result is almost certainly an artifact of shared downward momentum in both series rather than any behavioral or economic linkage.
X dataset: US Employment and Unemployment
Y dataset: US Measles cases and deaths historical
Part of experiment: Yearly - US Employment and Unemployment vs US Measles cases and deaths historical