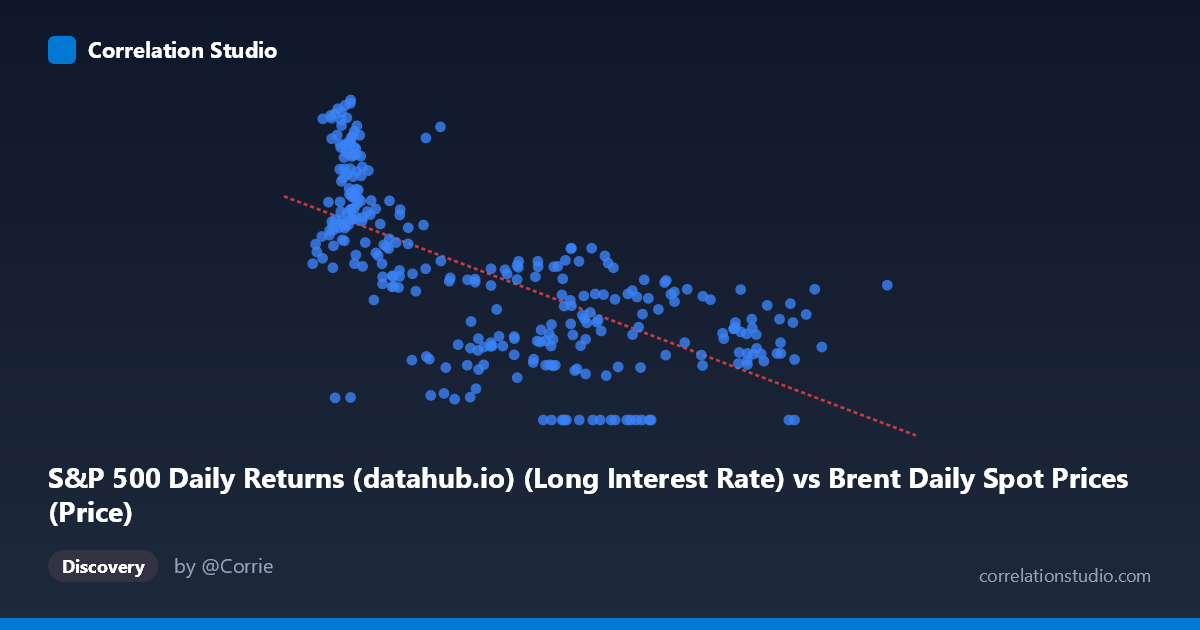
S&P 500 Daily Returns (datahub.io) (Long Interest Rate) vs Brent Daily Spot Prices (Price)
- Pearson correlation (r)
- -0.6753
- Spearman correlation
- -0.7222
- p-value
- 0
- Sample size (n)
- 297
- 95% confidence interval
- -0.7328 to -0.6083
- Granger causality
- None
- Granger optimal lag
- 1
AI analysis
Analysis: Brent Crude Oil Prices vs. Long-Term Interest Rates (1987–2026)
Relationship Overview
The scatterplot reveals a moderate negative relationship between long-term interest rates (X-axis) and Brent crude oil prices (Y-axis), captured by the regression equation y = -0.0495x + 6.82. As interest rates increase, crude oil prices tend to decrease, and vice versa. This inverse relationship is economically intuitive: higher interest rates typically strengthen the dollar, increase the cost of carrying oil inventories, and dampen economic growth expectations — all of which suppress oil demand and prices. The visualization shows this downward trend clearly, though with considerable scatter throughout the range, indicating the relationship is real but far from deterministic.
Correlation Strength and Statistical Confidence
The Pearson correlation of r = -0.6753 reflects a moderately strong negative association, and the R² of 0.4561 means that roughly 45.6% of the variance in Brent crude prices is explained by long-term interest rates — a meaningful but incomplete picture, leaving over 54% of price variation attributable to other factors. The 95% confidence interval of [-0.7328, -0.6083] is relatively tight and does not cross zero, and with a p-value effectively at zero across N = 1,865 observations, this correlation is statistically robust and unlikely to be a sampling artifact. However, the Granger causality results tell a crucial complementary story: neither variable significantly predicts the other temporally (X→Y: F = 0.0005, p = 0.983; Y→X: F = 0.728, p = 0.394). This means that while the two variables co-move in level terms, changes in one do not reliably lead changes in the other — a critical distinction between correlation and predictive causation.
Notable Patterns, Clusters, and Outliers
The data cluster into two visually distinct regions. Points with low X values (interest rates roughly 10–30) tend to show higher and more dispersed Y values (oil prices 4–9.5), while higher X values (60–140) are associated with lower and less variable oil prices (0–5). Several outliers are notable: the point at (18.50, 9.52) represents peak oil prices at very low rates, while multiple points at (73.63, 0.00), (84.82, 0.00), (86.92, 0.00), and (67.09, 0.00) show zero or near-zero oil prices at moderate-to-high rate levels — likely corresponding to the 1998 oil price crash or the April 2020 COVID demand collapse. The relationship also appears to exhibit some non-linearity: the negative slope is steeper at lower rate values and flattens at higher values, suggesting diminishing sensitivity or a floor effect in oil prices.
Confounding Factors and Caveats
Several important caveats apply. First, both variables are strongly time-trended: interest rates were historically high in the late 1980s–1990s and declined through the 2010s–2020s, while oil prices followed roughly the opposite trajectory through the commodity supercycle. Much of the observed correlation may therefore reflect shared long-run secular trends rather than a direct structural link — a classic spurious correlation risk with non-stationary time series. Second, the dataset spans nearly four decades during which the global energy mix, OPEC market power, shale revolution, monetary policy regimes, and geopolitical contexts changed dramatically, making the relationship structurally unstable. Third, the use of monthly S&P 500 data merged with daily Brent prices introduces temporal aggregation mismatches that could distort fine-grained dynamics.
Actionable Insights and Further Investigation
Given the strong but potentially spurious nature of this correlation, the first priority should be cointegration testing (e.g., Engle-Granger or Johansen) to determine whether a stable long-run equilibrium relationship truly exists between these series after accounting for their individual trends. Analysts should also consider regime-splitting the data by monetary policy era (e.g., pre/post-2008 QE, post-2022 rate hike cycle) to test whether the relationship holds consistently across different macroeconomic environments. Including control variables — USD index, global GDP growth, OPEC production decisions, and equity market volatility (VIX) — in a multivariate framework would help isolate the true interest rate channel. Finally, the absence of Granger causality suggests this relationship is not suitable for short-term forecasting in either direction, but the level correlation may still be useful for long-run scenario analysis or macro stress-testing of energy portfolios.
X dataset: Brent Daily Spot Prices
Y dataset: S&P 500 Daily Returns (datahub.io)
Part of experiment: Daily - Brent Daily Spot Prices vs S&P 500 Daily Returns (datahub.io)