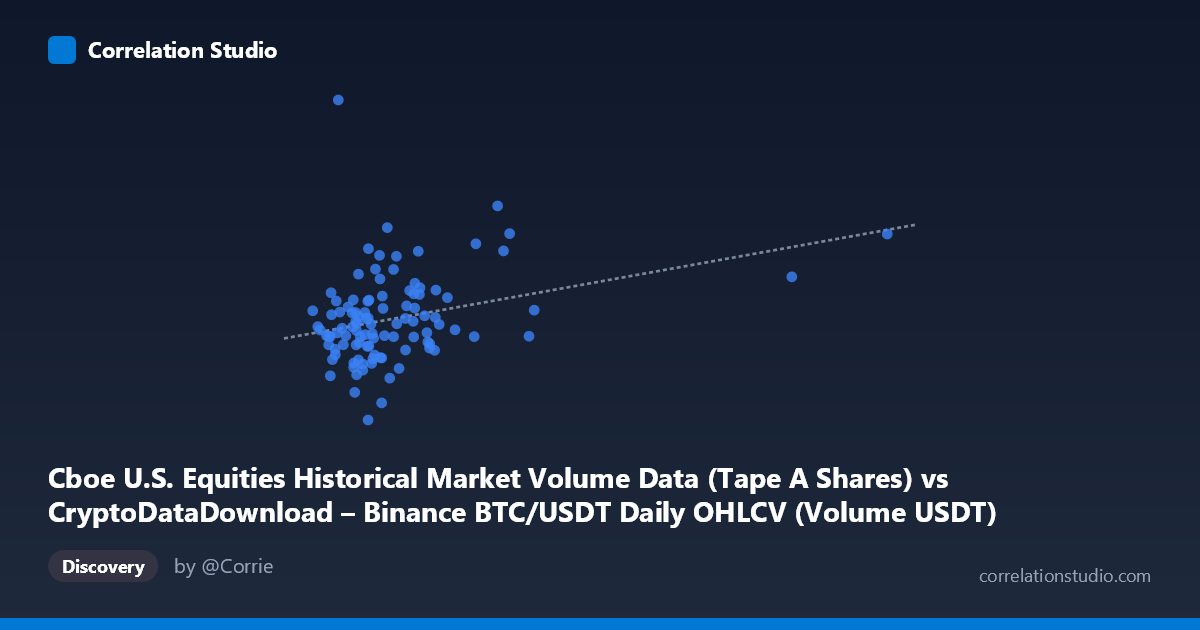
Cboe U.S. Equities Historical Market Volume Data (Tape A Shares) vs CryptoDataDownload – Binance BTC/USDT Daily OHLCV (Volume USDT)
- Pearson correlation (r)
- 0.4238
- Spearman correlation
- 0.3639
- p-value
- 0.000032
- Sample size (n)
- 90
- 95% confidence interval
- 0.2376 to 0.58
- Granger causality
- None
- Granger optimal lag
- 10
AI analysis
Analysis: Cboe Equities Volume vs. Binance BTC/USDT Volume
1. Overall Relationship
The scatterplot shows a moderate positive relationship between Cboe U.S. equities Tape A volume (X-axis) and Binance BTC/USDT notional trading volume (Y-axis). The bulk of observations cluster tightly in the lower-left region (X roughly 800M–2.5B, Y roughly 220M–330M), with a sparse tail of higher-X points extending out to ~7.2B. This clustering pattern, combined with the tail, suggests the correlation is being influenced disproportionately by a handful of high-volume days rather than a uniform linear trend across the full range.
2. Strength, Direction, and Statistical Confidence
The correlation coefficient (r = 0.424) indicates a moderate positive linear association, but r² = 0.180 tells the more important story: only about 18% of the variance in Binance volume is explained by Cboe equities volume, leaving 82% driven by other factors. The 95% CI [0.238, 0.580] is fairly wide, reflecting real uncertainty in the true population relationship — the effect could be anywhere from weak-moderate to moderately strong. The p-value (3.15E-05) confirms the correlation is statistically significant and unlikely due to chance in this sample, but statistical significance here should not be conflated with practical/predictive strength given the low r². Critically, the Granger causality tests show no significant predictive direction in either direction (X→Y p=0.367, Y→X p=0.800) at the optimal 10-period lag. This means despite the contemporaneous correlation, neither series reliably helps forecast the other over time — the relationship is likely coincidental co-movement (e.g., both trending upward over the shared time window) rather than a lead-lag causal dynamic.
3. Notable Patterns and Outliers
Several high-leverage points stand out: the extreme value at X≈7.2B (Y≈356M) and a cluster around X≈2.9–3.3B and X≈6.1B. These points sit far from the main data cloud and likely exert substantial influence on both the regression slope and the correlation coefficient — removing them could markedly change r² and the CI width. Within the dense low-X cluster, the relationship looks nearly flat/noisy, with Y ranging widely (220M–380M) for a narrow band of X values, suggesting little to no linear signal in the "typical" trading day regime. The apparent trend is thus driven largely by a few days with unusually high Cboe volume that also coincided with higher BTC volume.
4. Confounding Factors and Caveats
Both series are volume metrics that naturally trend with overall market activity, volatility regimes, and macro conditions (e.g., risk-on/risk-off days, major news events, quarterly triple-witching, options expiration, or crypto-specific catalysts). A shared underlying driver — such as general market volatility or a common calendar effect — could inflate the correlation without any direct causal link between equities and crypto volume. Additionally, n=90 is a small sample relative to the full population (N=1,980), increasing sampling variability, and the extreme skew in X (stdev nearly 910M against a mean of 1.74B) means outliers have outsized leverage on both the correlation and the regression line. The linear model (y = 0.0156x + 254.6M) also may not capture true structure if the relationship is nonlinear or threshold-based (e.g., only extreme equity volume days matter).
5. Recommendations
Given the weak Granger results, this correlation should not be used for short-term predictive trading signals in either direction. Further investigation should: (a) test for a common latent driver (e.g., VIX, overall crypto market volatility index, or news/event dummy variables) using multivariate regression; (b) re-run the correlation after winsorizing or removing the extreme X outliers to check robustness; (c) examine whether the relationship strengthens on specific event days (e.g., FOMC announcements, ETF news) versus routine trading days; and (d) extend the time series and re-test Granger causality with alternative lag structures, since the current 10-period optimal lag showed no significance — shorter or asymmetric lags might reveal a different dynamic.
X dataset: CryptoDataDownload – Binance BTC/USDT Daily OHLCV
Y dataset: Cboe U.S. Equities Historical Market Volume Data
Part of experiment: Bitcoin - CryptoDataDownload – Binance BTC/USDT Daily OHLCV vs Cboe U.S. Equities Historical Market Volume Data