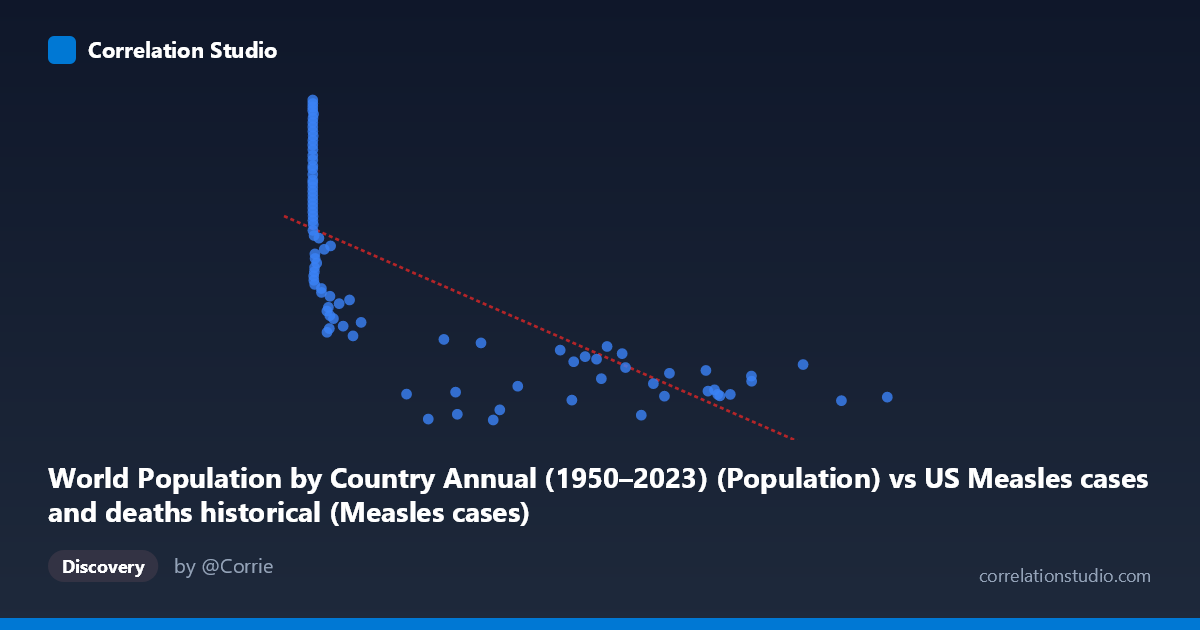
World Population by Country Annual (1950–2023) (Population) vs US Measles cases and deaths historical (Measles cases)
- Pearson correlation (r)
- -0.7345
- Spearman correlation
- -0.9103
- p-value
- 0
- Sample size (n)
- 90
- 95% confidence interval
- -0.8173 to -0.6221
- Granger causality
- None
- Granger optimal lag
- 10
AI analysis
Analysis: World Population vs. US Measles Cases
1. Overall Relationship Revealed
The scatterplot reveals a negative relationship between world population (X-axis) and US measles cases (Y-axis), where higher population values correspond to lower measles case counts. Visually, the data exhibits a pronounced non-linear, hyperbolic or logarithmic decay pattern — measles cases drop sharply as population moves from very low to moderate values, then flatten considerably at higher population values. This characteristic "hockey stick" shape is a strong visual signal that a simple linear model, while statistically significant, likely misrepresents the true functional form of the relationship. The temporal framing (1919–2023) provides important context: this scatter essentially captures the long arc of measles epidemiology in the US across a century of growing global population.
2. Correlation Strength, Direction, and Causality
The Pearson correlation of r = −0.7345 indicates a moderately strong negative association, and the R² of 0.5395 means that approximately 54% of the variance in US measles cases is explained by world population within this linear framework — a substantial but far from complete explanation. The 95% confidence interval for r spans [−0.8173, −0.6221], which is relatively tight and entirely negative, confirming that the inverse relationship is robust and not a sampling artifact. The p-value of 2.22×10⁻¹⁶ is effectively zero, making this correlation highly statistically significant across the n = 90 paired observations.
However, the Granger causality results are telling: neither direction (X→Y nor Y→X) reaches significance at any conventional threshold (F = 1.31, p = 0.247 for X→Y; F = 0.83, p = 0.601 for Y→X), even at the optimal lag of 10 periods. This means that world population does not temporally predict US measles cases, and vice versa — the correlation is associative rather than predictive in a time-series sense. Furthermore, the note that Spearman ρ exceeds Pearson r confirms that the linear model is underfitting the true relationship; a logarithmic or power-law regression would likely explain substantially more variance and better capture the data's curvature.
3. Notable Patterns, Clusters, and Outliers
Several structural features stand out:
- High-leverage cluster at low X values (population < 50,000): Points in this region show extremely high and highly variable measles case counts — ranging from roughly 37 million to over 163 million — representing the pre-vaccine era (1919–~1963) when measles was endemic and epidemic cycles caused massive annual fluctuations. The enormous vertical spread here drives much of the correlation's apparent noise. - Dense cluster at high X values (population 400,000): These points compress tightly near the bottom of the Y-axis (below ~70 million cases), reflecting the post-vaccine era where measles was dramatically suppressed regardless of further population growth. - Notable outliers: The point at approximately (59, 163,211,907) represents an extraordinary measles year with the highest case count in the dataset. Similarly, (121, 161,811,336) and (1274, 157,652,893) stand out as extreme high-case years at very low population values. At the other extreme, (280,930, 37,422,648) and (179,829, 37,790,931) represent the lowest measles burdens, occurring at intermediate population values — possibly reflecting transitional years around vaccine introduction. - Non-linearity confirmation: The linear regression line (y = −110.78x + 112,642,000) would systematically overpredict measles cases at intermediate X values and underpredict at the extremes, consistent with the logarithmic decay structure visible in the plot.
4. Confounding Factors and Interpretive Caveats
This correlation is almost certainly spurious in a causal sense — it is a textbook example of a time-trend confound. Both variables are indexed to time: world population grows monotonically over 1919–2023, while US measles cases declined dramatically following the introduction of the measles vaccine in 1963 and the subsequent 1978 immunization initiative. The real causal driver of declining measles cases is vaccination coverage, not world population growth. Other confounders include:
- Changes in surveillance and reporting methodology over a century, which affect case count comparability - US population growth (distinct from world population) and associated herd immunity thresholds - Epidemic cycling in the pre-vaccine era, which introduces large year-to-year variance unrelated to population - Immigration patterns and importation events, particularly relevant in near-elimination periods - The dataset mismatch in source labeling (the axis notes appear transposed — Population from measles dataset and Measles cases from population dataset) warrants verification of data alignment
The Granger non-causality result is actually theoretically reassuring here: it correctly flags that population size is not a meaningful temporal predictor of measles transmission dynamics, supporting the interpretation that the correlation is driven by their shared temporal trend.
5. Actionable Insights and Further Investigation
- Replace linear regression with a logarithmic model (y = a·ln(x) + b) or a piecewise segmented regression with a structural break at ~1963 (vaccine introduction). This would likely push R² well above 0.70 and yield a more honest characterization of the relationship. - Partial out the time trend by including year as a covariate or by first-differencing both series, then re-examining the residual correlation between population and measles cases — this would reveal whether any relationship persists beyond the shared temporal drift. - Stratified analysis: Analyze pre-1963 and post-1963 periods separately. The pre-vaccine era likely shows no meaningful population-measles correlation (just epidemic noise), while the post-vaccine era would show near-zero variance in measles cases regardless of population. - Substitute a causally meaningful X-variable such as US vaccination coverage rates, measles-specific funding, or CDC immunization program milestones, which would yield a far more interpretable and actionable model. - Cross-country comparison: Using the world population dataset's country-level granularity, investigate whether countries with faster population growth show different measles trajectories, controlling for vaccine introduction timing — a potentially rich epidemiological question the data could support.
X dataset: US Measles cases and deaths historical
Y dataset: World Population by Country Annual (1950–2023)
Part of experiment: Yearly - US Measles cases and deaths historical vs World Population by Country Annual (1950–2023)