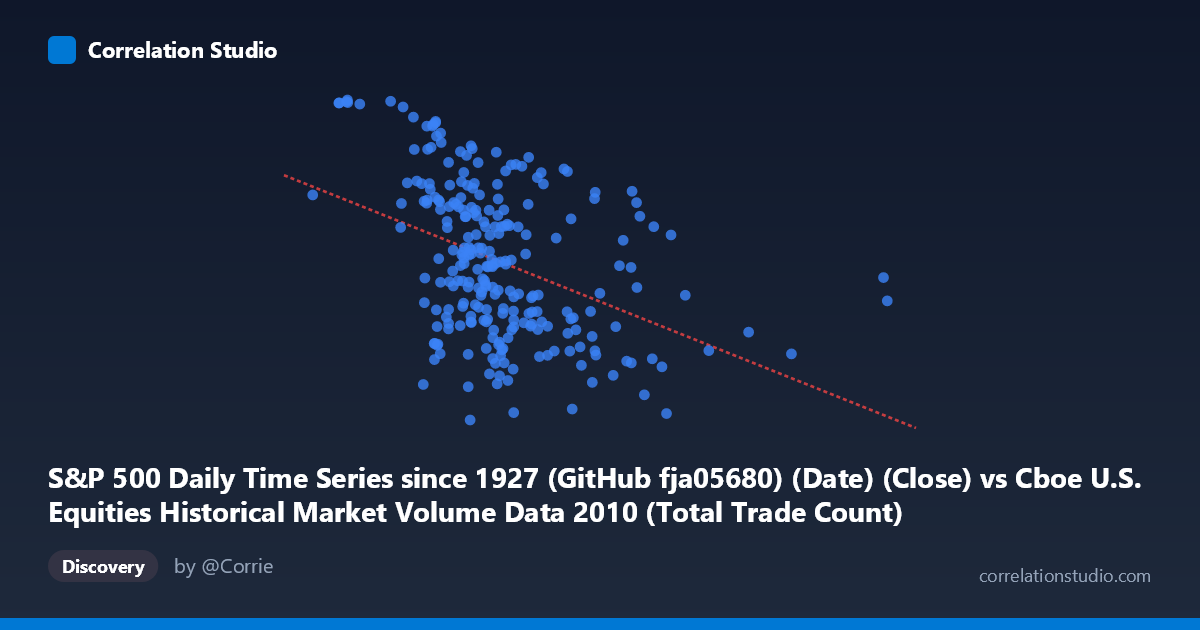
S&P 500 Daily Time Series since 1927 (GitHub fja05680) (Date) (Close) vs Cboe U.S. Equities Historical Market Volume Data 2010 (Total Trade Count)
- Pearson correlation (r)
- -0.4095
- Spearman correlation
- -0.4322
- p-value
- 0
- Sample size (n)
- 252
- 95% confidence interval
- -0.5074 to -0.3011
- Granger causality
- Y → X
- Granger optimal lag
- 1
AI analysis
Analysis: S&P 500 Close Price vs. U.S. Equities Total Trade Count (2010)
Relationship Overview The scatterplot reveals a moderate negative relationship between the S&P 500 daily closing price (X-axis) and the total trade count across U.S. equity exchanges (Y-axis) throughout 2010. As the S&P 500 closing price increased over the year, the daily number of trades tended to decline. This inverse pattern is visually apparent as a downward-sloping point cloud, though with considerable scatter around the trend line (y = −3.50×10⁻⁵x + 1218.22). The relationship suggests that higher market valuations during 2010 were associated with quieter, less fragmented trading activity — a somewhat counterintuitive finding at first glance, but consistent with the idea that rising, calmer bull markets often see reduced high-frequency churn compared to volatile, lower-price environments.
Correlation Strength and Statistical Significance The Pearson correlation of r = −0.4095 indicates a moderate negative association, though the r² of 0.168 means that only about 16.8% of the variance in daily trade count is explained by the S&P 500 closing price alone — leaving roughly 83% attributable to other factors. The relationship is nonetheless highly statistically significant (p = 1.32×10⁻¹¹), with a 95% confidence interval for r of [−0.507, −0.301], confirming the negative direction is unlikely to be a sampling artifact across the n = 252 paired daily observations drawn from a population of N = 3,302. Crucially, the Granger causality analysis points in one direction only: trade count (Y) Granger-causes S&P 500 price (X) at a 1-period lag (F = 4.29, p = 0.039), while the reverse direction (X→Y) fails to reach significance (F = 2.12, p = 0.146). This means past trade count activity has modest temporal predictive power over next-day S&P 500 levels, but price movements do not similarly predict future trade counts — an asymmetric and practically meaningful finding.
Notable Patterns, Clusters, and Outliers Several structural features stand out in the data. There is a dense central cluster of observations concentrated roughly between S&P 500 levels of 1,700,000–2,500,000 (in the notional/volume scale used) and trade counts between 1,080–1,210, representing the bulk of typical trading days. At the lower X extreme (roughly below 1,400,000), trade counts are disproportionately elevated — several points approach or exceed 1,230–1,259, consistent with the volatile, high-activity early months of 2010. Conversely, the high-X tail contains notable outliers: the point at approximately X = 5,514,533 with a trade count near 1,111 sits far to the right of the main cloud and likely represents an anomalous volume spike day (potentially a macro event or index rebalancing). A few high-trade-count outliers near Y = 1,256–1,259 (e.g., around X ≈ 1,047,000 and 1,308,000) also stand apart and may correspond to specific market stress events such as the May 2010 Flash Crash period.
Confounding Factors and Interpretive Caveats Several important caveats apply. First, both variables are time-indexed, meaning much of the observed correlation may reflect shared temporal trends rather than a direct economic link — the S&P 500 generally trended upward through 2010 while algorithmic trade fragmentation may have been declining for structural reasons unrelated to price level. The Granger result, while suggestive, only establishes predictive precedence at a 1-day lag, not true causation. Second, exchange-level structural changes in 2010 (e.g., shifts in maker-taker fee schedules, the post-Flash Crash regulatory environment, or changes in HFT participation) could simultaneously suppress trade counts and correlate with price recovery — a classic confound. Third, the X-axis label metadata appears inverted in the dataset descriptions (S&P 500 date/close is labeled as the X variable but sourced from the Cboe volume dataset), suggesting a possible data join artifact that warrants verification before drawing firm conclusions.
Actionable Insights and Further Investigation Practitioners interested in market microstructure should explore whether the Granger predictive signal from trade count to S&P 500 price holds out-of-sample across other years, particularly in different volatility regimes (e.g., 2008, 2020). It would be valuable to partial out the time trend from both series (via detrending or differencing) to test whether the correlation persists after removing shared temporal drift — if it vanishes, the relationship is largely spurious. Decomposing trade count by exchange venue (Cboe BZX, NYSE, NASDAQ, TRFs) could isolate whether the signal is driven by lit versus dark pool activity. Finally, incorporating VIX or realized volatility as a control variable would help distinguish whether it is price level per se driving trade count, or whether both are jointly responding to a latent volatility factor — a far more actionable hypothesis for trading strategy development.
X dataset: Cboe U.S. Equities Historical Market Volume Data 2010
Y dataset: S&P 500 Daily Time Series since 1927 (GitHub fja05680) (Date)
Part of experiment: Daily - Cboe U.S. Equities Historical Market Volume Data 2010 vs S&P 500 Daily Time Series since 1927 (GitHub fja05680) (Date)