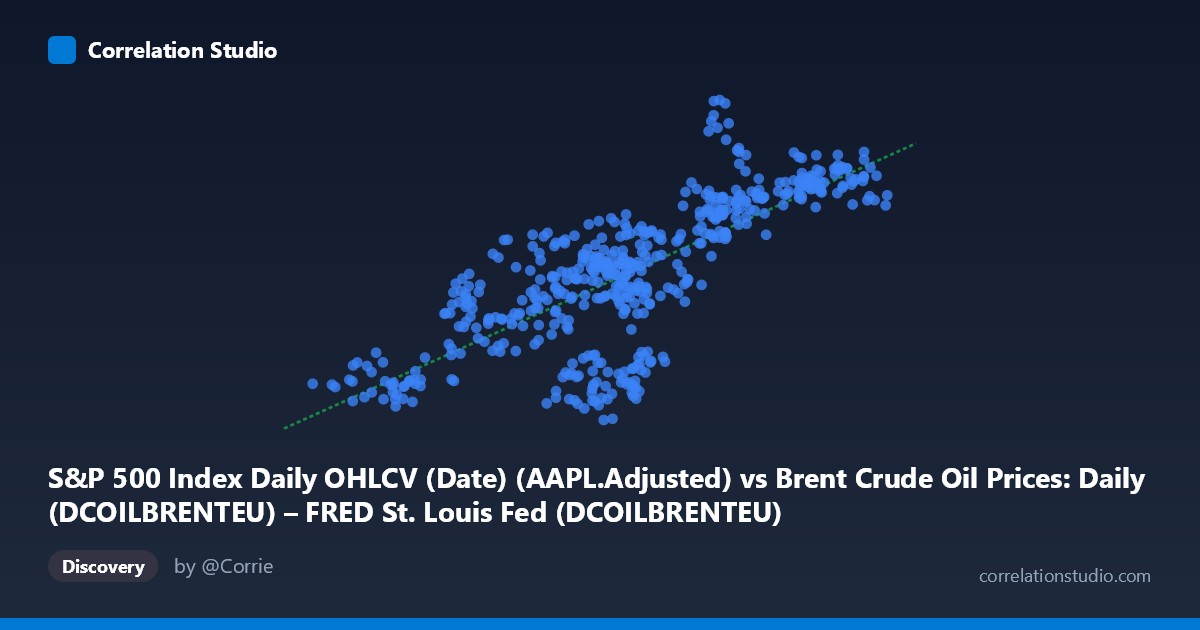
S&P 500 Index Daily OHLCV (Date) (AAPL.Adjusted) vs Brent Crude Oil Prices: Daily (DCOILBRENTEU) – FRED St. Louis Fed (DCOILBRENTEU)
- Pearson correlation (r)
- 0.76
- Spearman correlation
- 0.776
- p-value
- 0
- Sample size (n)
- 504
- 95% confidence interval
- 0.7204 to 0.7946
- Granger causality
- None
- Granger optimal lag
- 1
AI analysis
Analysis: AAPL Adjusted Price vs. Brent Crude Oil Price (2015–2017)
1. Overall Relationship The scatterplot reveals a moderate-to-strong positive relationship between AAPL's adjusted stock price (x-axis) and Brent Crude Oil prices (y-axis) over the two-year period from February 2015 to February 2017. As AAPL's price rises roughly from ~$26 to ~$66, Brent crude tends to climb from ~$89 to ~$135. The linear regression (y = 0.934x + 65.35) suggests that for every $1 increase in AAPL's adjusted price, Brent crude is associated with approximately a $0.93 increase — a near one-to-one slope that superficially implies proportional co-movement, though this is almost certainly a spurious artifact of shared macro trends rather than any direct economic linkage.
2. Correlation Strength, Direction, and Causality The Pearson correlation of r = 0.76 indicates a strong positive association, and the R² of 0.578 means that approximately 57.8% of the variance in Brent crude prices is statistically explained by AAPL's price movements within this sample — a striking figure for two ostensibly unrelated assets. The 95% confidence interval of [0.720, 0.795] is narrow and sits well above zero, and the p-value ≈ 0 confirms this is not a chance finding in a statistical sense. However, the Granger causality results decisively undermine any causal interpretation: neither direction (X→Y: F=0.142, p=0.707; Y→X: F=0.640, p=0.424) approaches significance. Neither variable temporally predicts the other, meaning that knowing today's AAPL price adds no meaningful information about tomorrow's Brent crude price, and vice versa. This is a textbook case of correlation without predictive causation.
3. Notable Patterns, Clusters, and Outliers Several structural features stand out in the data: - There is a visible lower-left cluster of points (AAPL ~$26–$38, Brent ~$89–$108), likely corresponding to the period of low oil prices and lower AAPL valuations in early-to-mid 2015 or early 2016. - A denser central cloud around AAPL $43–$55 and Brent $100–$120 dominates the distribution, reflecting the bulk of trading days. - A upper-right cluster (~$57–$66 AAPL, ~$118–$135 Brent) suggests a later recovery period for both assets simultaneously. - At least one notable outlier appears near (54.16, 135.35) — Brent crude at an unusually high value relative to the regression line — which may correspond to a specific supply shock or geopolitical event. - The spread around the regression line widens at higher X values, hinting at mild heteroscedasticity and suggesting the linear model may underfit variance in the upper range.
4. Confounding Factors and Caveats The correlation here is almost certainly driven by a common latent factor rather than any direct economic relationship between Apple's stock and crude oil prices. The most likely confounders include: - Broad macroeconomic cycles: Both assets recovered from a global risk-off period (late 2015/early 2016) and subsequently rallied — their co-movement may simply reflect synchronized global risk appetite. - USD strength: Both oil prices and equity valuations are sensitive to U.S. dollar movements; a weakening dollar tends to lift both simultaneously. - Time-series non-stationarity: Both series likely share upward trends over this window, inflating the correlation coefficient artificially — a classic spurious regression problem. Differencing both series would likely produce a substantially lower correlation. - Axis labeling anomaly: It is worth noting that the dataset descriptions appear swapped in the axis labels (the AAPL column is listed under the Brent dataset name and vice versa), which warrants verification of data integrity before drawing any conclusions.
5. Actionable Insights and Further Investigation Given these findings, several follow-up steps are warranted: - Verify data alignment: Confirm the axis labels are correctly assigned; the apparent mislabeling could indicate a data join error that would invalidate the entire analysis. - Detrend both series using first-differences or log-returns before recalculating correlation — this would reveal whether the relationship persists beyond shared secular trends or is indeed spurious. - Extend the Granger causality test to longer lags (e.g., 5–20 trading days) to ensure the lag-1 finding is robust and not masking delayed predictive relationships. - Introduce control variables (USD index, VIX, S&P 500 broad index) to partial out macro-level noise and isolate any residual co-movement. - Regime analysis: Segment the data by the 2016 oil price trough to test whether the correlation is driven entirely by a single recovery cycle, which would severely limit generalizability beyond this two-year window.
X dataset: Brent Crude Oil Prices: Daily (DCOILBRENTEU) – FRED St. Louis Fed
Y dataset: S&P 500 Index Daily OHLCV (Date)
Part of experiment: Daily - Brent Crude Oil Prices: Daily (DCOILBRENTEU) – FRED St. Louis Fed vs S&P 500 Index Daily OHLCV (Date)