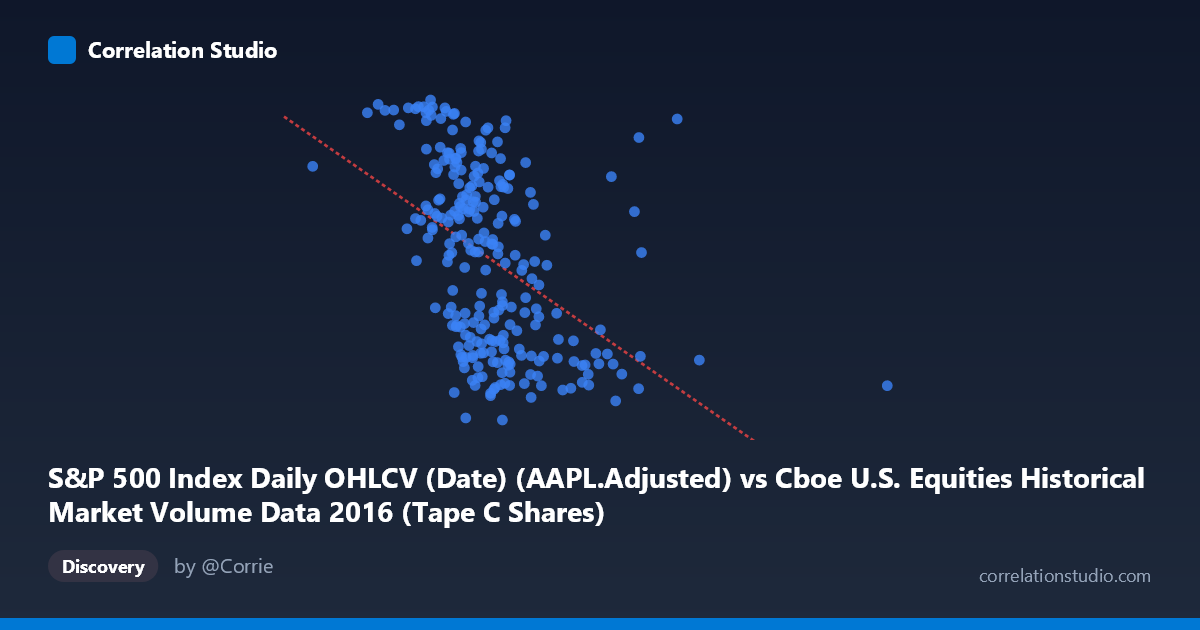
S&P 500 Index Daily OHLCV (Date) (AAPL.Adjusted) vs Cboe U.S. Equities Historical Market Volume Data 2016 (Tape C Shares)
- Pearson correlation (r)
- -0.4492
- Spearman correlation
- -0.5184
- p-value
- 0
- Sample size (n)
- 252
- 95% confidence interval
- -0.5427 to -0.3448
- Granger causality
- None
- Granger optimal lag
- 1
AI analysis
Scatterplot Analysis: AAPL Adjusted Price vs. Cboe Tape C Share Volume (2016)
Relationship Overview The scatterplot reveals a negative relationship between Apple's adjusted closing price (X-axis) and Cboe Tape C share volume (Y-axis) across 252 trading days in 2016. As AAPL's adjusted price increases, Tape C share volume tends to decrease. This inverse pattern is broadly consistent with a well-documented market dynamic: higher individual stock prices are often associated with reduced share volume, as fewer shares are traded at elevated price levels. The linear regression equation (y = -1.319×10⁻⁷x + 120.691) confirms a shallow but negative slope, with the X variable's range spanning roughly $51M–$315M in adjusted price units, while Y (Tape C shares) clusters predominantly between 89 and 117.
Correlation Strength and Statistical Significance The Pearson correlation of r = -0.4492 indicates a moderate negative association, but the more meaningful metric is r² = 0.2018, meaning only about 20.2% of the variance in Tape C share volume is explained by AAPL's adjusted price. The remaining ~80% of variability is attributable to other factors entirely. The 95% confidence interval for r spans [-0.5427, -0.3448], which is moderately wide but does not cross zero, reinforcing that the negative direction is reliable. The p-value of 6.42×10⁻¹⁴ is extraordinarily small, confirming this relationship is highly statistically significant and extremely unlikely to be a chance artifact given n = 252. However, statistical significance here is heavily driven by the large sample size — the practical magnitude of the effect remains modest.
Granger Causality and Temporal Dynamics Despite the statistically significant correlation, Granger causality tests reveal no significant predictive directionality in either direction — neither X→Y (F = 1.04, p = 0.308) nor Y→X (F = 0.50, p = 0.478) achieves significance at the optimal lag of 1 period. This is a critical finding: knowing today's AAPL price does not meaningfully improve predictions of tomorrow's Tape C volume, and vice versa. This dissociates the statistical correlation from any temporal causal narrative, suggesting the observed relationship is more likely a contemporaneous co-movement driven by shared underlying market forces (e.g., overall market conditions, volatility regimes) rather than a lead-lag predictive mechanism.
Notable Patterns, Clusters, and Outliers The sample points reveal considerable vertical scatter at similar X values — for instance, AAPL prices near $115M–$125M correspond to Tape C values ranging widely from ~89 to ~117, illustrating the weak explanatory power despite significance. There appear to be a few potential outliers with notably high Tape C volumes (~116–117) occurring at relatively lower AAPL price levels (e.g., ~$99.8M), consistent with the negative trend but extending beyond the central cluster. The data also shows a mild funnel or heteroscedastic pattern, where lower AAPL price values exhibit more dispersed Y values, while higher prices tend to compress around lower volume levels. No strong non-linear curvature is immediately apparent, though the wide scatter leaves open the possibility that a non-linear model could marginally improve fit.
Caveats, Confounders, and Further Investigation Several important caveats apply. First, the axis labels appear inverted in the dataset metadata (X is labeled as AAPL adjusted price from a volume dataset, and Y is Tape C shares from an OHLCV dataset), which warrants verification of data alignment before drawing firm conclusions. Second, confounding by market-wide factors — such as the 2016 U.S. election volatility, Brexit spillovers, and AAPL's own product cycles — likely contributes to both variables simultaneously, inflating apparent correlation. Third, the moderate r² leaves most variance unexplained, suggesting that additional predictors (VIX, overall NYSE volume, sector rotation flows) should be incorporated into a multivariate model. Further investigation should include: (1) decomposing both series for seasonality and trend to test whether the correlation persists in residuals; (2) testing non-linear regression specifications; and (3) examining rolling correlations across sub-periods of 2016 to assess whether the relationship was stable or regime-dependent throughout the year.
X dataset: Cboe U.S. Equities Historical Market Volume Data 2016
Y dataset: S&P 500 Index Daily OHLCV (Date)
Part of experiment: Daily - Cboe U.S. Equities Historical Market Volume Data 2016 vs S&P 500 Index Daily OHLCV (Date)