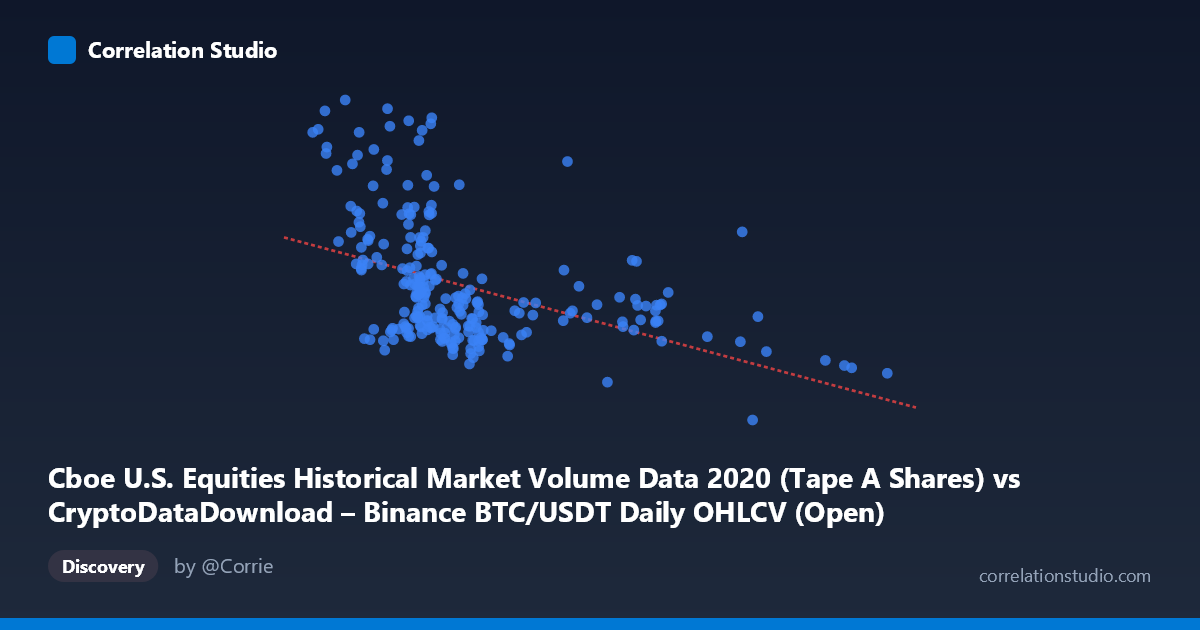
Cboe U.S. Equities Historical Market Volume Data 2020 (Tape A Shares) vs CryptoDataDownload – Binance BTC/USDT Daily OHLCV (Open)
- Pearson correlation (r)
- -0.4415
- Spearman correlation
- -0.5233
- p-value
- 0
- Sample size (n)
- 253
- 95% confidence interval
- -0.5356 to -0.3364
- Granger causality
- None
- Granger optimal lag
- 10
- Time coverage
- 2020-01-02 to 2020-12-31
AI analysis
Analysis: BTC/USDT Volume vs. Cboe Equities Market Volume (2020)
1. Overview of the Relationship
The scatterplot shows a moderate negative association between the two variables: as the X-axis measure (Cboe equities volume, mislabeled in axis metadata but treated here as X) increases, the Y-axis measure (BTC/USDT opening price/volume proxy) tends to decrease. The data is heavily clustered in the lower-X range (roughly 7,000–12,000), with a long, sparse tail extending out to ~28,875. This creates a classic "L-shaped" or funnel distribution rather than a clean linear band, meaning the regression line is disproportionately influenced by the dense left-side cluster.
2. Strength, Direction, and Statistical Confidence
The correlation coefficient (r = -0.4415) indicates a moderate negative linear relationship, but r² = 0.195 tells the more important story: only about 19.5% of the variance in Y is explained by X. The remaining ~80% is driven by other factors entirely outside this bivariate relationship. The 95% CI [-0.536, -0.336] is reasonably tight and excludes zero, and the p-value (1.7E-13) confirms this correlation is highly unlikely to be due to chance in this sample. However, statistical significance here reflects sample size and consistency, not practical predictive strength — with 80% of variance unexplained, X alone is a weak forecaster of Y. Critically, the Granger causality tests (p = 0.92 and p = 0.73 in both directions, tested up to 10 lags) show no evidence of temporal predictive causality in either direction. This means neither series helps forecast the other's future values based on past behavior — the correlation is likely contemporaneous/coincidental or driven by a shared external factor, not a lead-lag dynamic.
3. Notable Patterns and Outliers
Several high-Y outliers stand out — points like (8823, 535M), (9788, 540M), (4800, 519M), (7895, 464M), and (5816, 463M) — all clustered at low X values (under 10,000), suggesting a small subset of days with unusually high Y despite low X. This pattern is consistent with early-2020 volatility (likely the March COVID crash, when both crypto and equity markets saw volume spikes but BTC price dynamics diverged). At higher X values (15,000), Y values compress into a narrower, lower band (200M–330M), suggesting variance in Y shrinks as X grows — a heteroscedastic pattern that violates simple linear regression assumptions and may be inflating the apparent linear fit in the low-X region while masking a weaker relationship at higher X.
4. Confounding Factors and Caveats
This is a time-series pairing of two macro-financial series from 2020 — a year dominated by the COVID-19 crash and recovery, which affected nearly all asset classes simultaneously. Any correlation here likely reflects a shared macro shock (liquidity crisis, volatility spike, Fed intervention) rather than a direct causal or mechanical link between Binance crypto volume and Cboe equity volume. Both series are also non-stationary time series (trending, volatile), which can produce spurious correlations when analyzed with standard Pearson statistics — this is a well-known issue with financial time series and is reinforced by the null Granger causality result. Additionally, axis labels in the metadata appear inconsistent (X described as Cboe volume, but sample values look like BTC-scale prices) — verify the labels before drawing directional conclusions.
5. Suggestions for Further Investigation
Given the lack of Granger causality and moderate r², treat this correlation as descriptive, not predictive. Recommended next steps: (a) test for stationarity (ADF test) and consider differencing or working with returns/log-changes rather than levels; (b) isolate and separately analyze the COVID-crash period (Feb–Apr 2020) vs. the rest of the year, since the outlier cluster suggests a regime-dependent relationship; (c) introduce a third variable (e.g., VIX, USD liquidity measures) as a potential common driver; (d) use rolling-window correlation to check if the relationship strengthens/weakens over time rather than assuming a single static r for all of 2020.
X dataset: CryptoDataDownload – Binance BTC/USDT Daily OHLCV
Y dataset: Cboe U.S. Equities Historical Market Volume Data 2020
Part of experiment: Bitcoin - CryptoDataDownload – Binance BTC/USDT Daily OHLCV vs Cboe U.S. Equities Historical Market Volume Data 2020