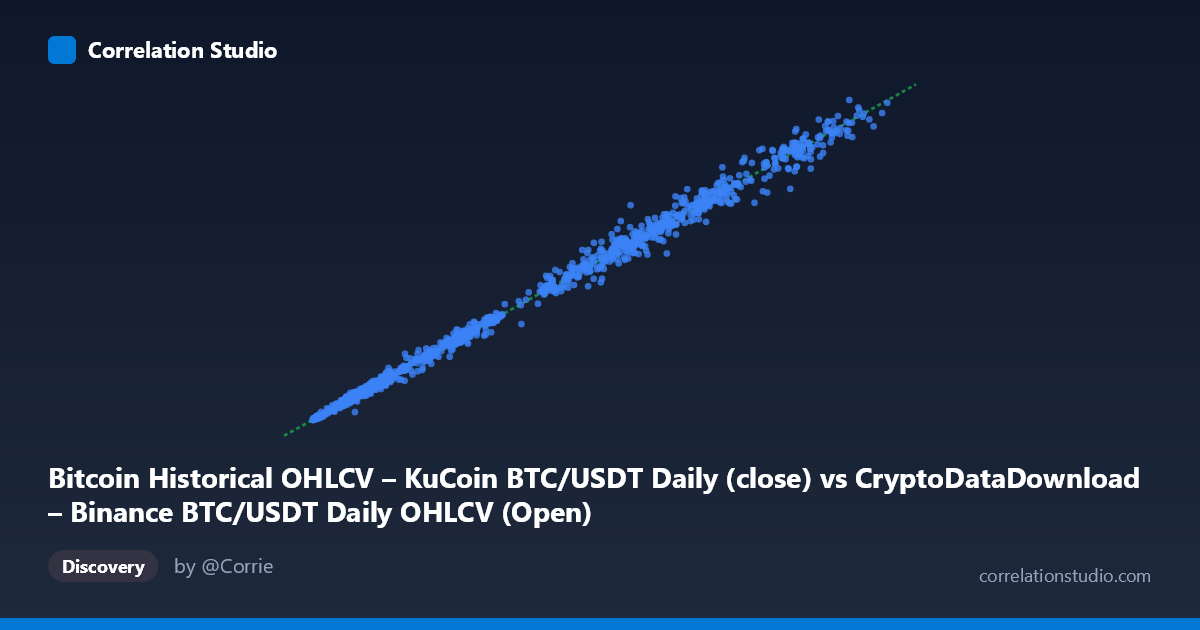
Bitcoin Historical OHLCV – KuCoin BTC/USDT Daily (close) vs CryptoDataDownload – Binance BTC/USDT Daily OHLCV (Open)
- Pearson correlation (r)
- 0.9982
- Spearman correlation
- 0.9975
- p-value
- 0
- Sample size (n)
- 1861
- 95% confidence interval
- 0.998 to 0.9983
- Granger causality
- None
- Granger optimal lag
- 10
- Time coverage
- 2017-10-19 to 2022-11-29
AI analysis
Analysis: BTC/USDT Price Series (Binance Close vs. KuCoin Open)
1. What the Visualization Reveals
The scatterplot shows an almost perfectly linear relationship between Binance BTC/USDT daily close prices and KuCoin BTC/USDT daily open prices. Points hug a tight diagonal band from the low thousands (~$3,200) up through the mid-$60,000s, with virtually no scatter deviation at any price level — low, mid, or high. The regression line (y = 0.998x + 39.1) is essentially the identity line, confirming that these two series track each other almost exactly across the entire observed range (Oct 2017–Nov 2022).
2. Strength, Direction, and Practical Meaning
This is not a "correlation" in the conventional statistical-inference sense — it's two measurements of the same underlying asset. r = 0.9982 (r² = 0.9964) means 99.64% of the variance in KuCoin's opening price is explained by Binance's closing price, with a razor-tight 95% CI [0.9980, 0.9983] and p ≈ 0. In practical terms, arbitrage and cross-exchange price efficiency keep BTC/USDT priced almost identically across Binance and KuCoin — a ~$39 additive offset with near-unity slope. The Granger causality test (optimal lag = 10 periods, both directions p 0.70) shows no significant lead-lag predictive relationship — neither series "Granger-causes" the other. This confirms the two markets are contemporaneously co-integrated rather than one driving the other with a delay; price discovery happens essentially simultaneously across exchanges, consistent with efficient, low-latency arbitrage.
3. Notable Patterns and Outliers
The relationship holds remarkably well across four orders of magnitude of price (from $3,200 to $67,500), spanning bear markets, the 2020–21 bull run, and the 2022 crash — indicating the tight coupling is structural, not regime-dependent. Minor deviations appear in the sample points at higher volatility periods (e.g., 31017 vs 29101, 56425 vs 53793, 47100 vs 48815), suggesting slightly larger absolute (though still small percentage) gaps during high-volatility days — likely reflecting temporary liquidity differences or lag in price updates during fast-moving markets. No meaningful clusters, discontinuities, or nonlinear curvature are visible; the relationship appears log-linear/linear throughout.
4. Confounding Factors and Caveats
Key caveats: (a) this is fundamentally a tautological relationship — both series measure the same asset's USD-denominated price, so high correlation is expected by construction, not a discovery about independent phenomena; (b) the "close" vs "open" timing mismatch between exchanges (Binance close vs. KuCoin next/same-period open) introduces a small, systematic time-alignment artifact that could inflate or dampen apparent lead-lag structure; (c) both series share common macro drivers (BTC market-wide sentiment, USD liquidity, regulatory news), so any inference about independent predictive power is not meaningful; (d) daily OHLCV aggregation smooths out intraday microstructure differences (spreads, order-book depth, fee structures) that could matter for high-frequency arbitrage analysis.
5. Actionable Insights
- For traders/arbitrageurs: the tiny, stable offset (~$39, <0.5% at low prices, negligible at high prices) suggests any cross-exchange arbitrage opportunities are minimal and fleeting on a daily-close basis — this analysis would need intraday/tick data to find exploitable spreads. - For further investigation: analyze the residuals (y − ŷ) over time to see if the offset widens during high-volatility or low-liquidity periods (e.g., May 2021, Nov 2022 FTX collapse) — this could reveal stress-testing signals for exchange health or liquidity risk. - Reframe the Granger test: given the near-identity relationship, a more informative analysis would examine intraday/high-frequency data or the residual series itself (rather than raw prices) to detect any genuine microstructure lead-lag effects between exchanges. - Caution against misuse: this correlation should not be used to claim causal or predictive insight between "Binance" and "KuCoin" markets — it primarily validates that BTC/USDT pricing is efficient and arbitrage-free at daily resolution.
X dataset: CryptoDataDownload – Binance BTC/USDT Daily OHLCV
Y dataset: Bitcoin Historical OHLCV – KuCoin BTC/USDT Daily
Part of experiment: Bitcoin - CryptoDataDownload – Binance BTC/USDT Daily OHLCV vs Bitcoin Historical OHLCV – KuCoin BTC/USDT Daily