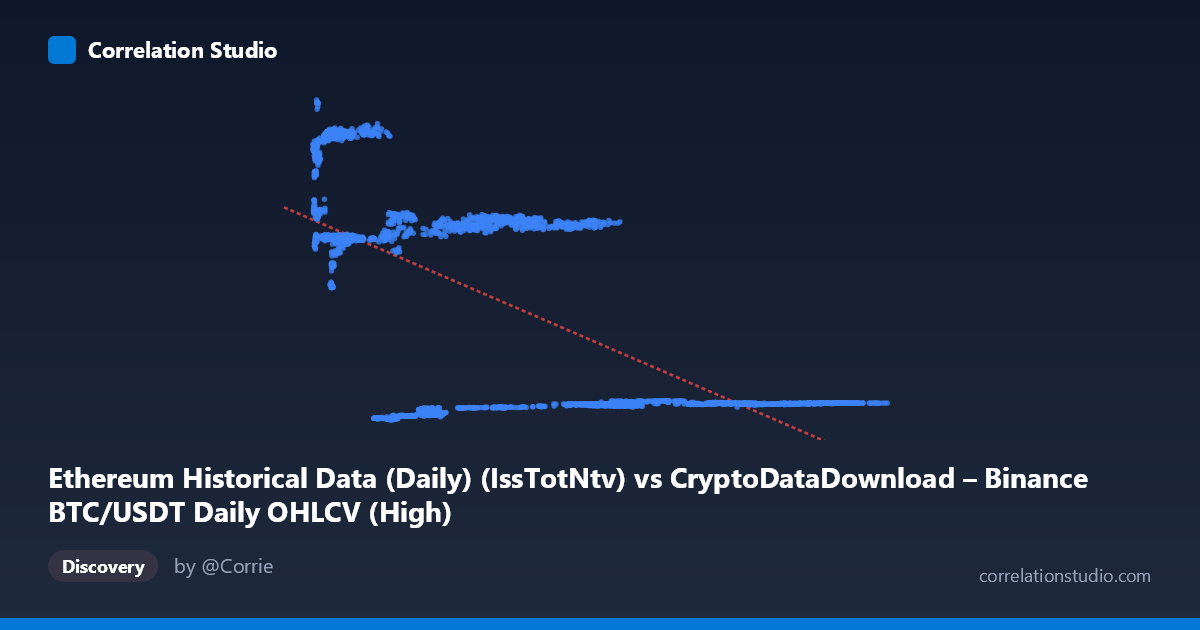
Ethereum Historical Data (Daily) (IssTotNtv) vs CryptoDataDownload – Binance BTC/USDT Daily OHLCV (High)
- Pearson correlation (r)
- -0.6385
- Spearman correlation
- -0.4698
- p-value
- 0
- Sample size (n)
- 3191
- 95% confidence interval
- -0.6586 to -0.6174
- Granger causality
- Y → X
- Granger optimal lag
- 10
AI analysis
Analysis of the Scatterplot Relationship
1. Overview of the Visualization
The scatterplot displays a clear negative, non-linear relationship between the two variables. Rather than a smooth linear decline, the data appears to cluster into distinct horizontal "bands" at roughly Y ≈ 2,000–3,000, Y ≈ 13,000–14,900, and Y ≈ 18,500–21,000, with X values spreading across a wide range within each band. This banding pattern suggests the data may represent discrete regime states or time-clustered periods rather than a continuous functional relationship — points don't smoothly trace a line but rather occupy plateaus.
2. Strength, Direction, and Statistical Confidence
The correlation coefficient (r = -0.6385) indicates a moderate-to-strong negative relationship, with r² = 0.4076 meaning only about 41% of the variance in Y is explained by X (or vice versa) — leaving the majority (59%) of variance attributable to other factors. The tight confidence interval [-0.6586, -0.6174] combined with p ≈ 0 confirms this correlation is highly statistically reliable, not a product of chance, despite the large sample size (n=3,191) making even modest correlations easily significant.
The Granger causality results add an important temporal dimension: Y Granger-causes X, not the other way around (Y→X: F=1.93, p=0.037; X→Y: F=0.63, p=0.786). This means past values of Y (Ethereum's IssTotNtv/issuance-related metric) have predictive power for future values of X (BTC/USDT price), but not vice versa. This is a notable and somewhat counterintuitive finding, since one might expect BTC price action to lead Ethereum network metrics rather than the reverse.
3. Notable Patterns and Outliers
The horizontal banding is the most striking feature — it implies Y takes on semi-discrete values across a wide X range, which is unusual for two continuously-varying financial/network metrics. This could indicate: - Regime shifts in Ethereum network activity (e.g., protocol upgrades, EIP-1559 changes, gas limit adjustments) causing step-changes in the Y metric independent of BTC price - Data structured in phases where Y is measured differently across time periods - Possible rate-limiting, caps, or categorical encoding artifacts in the underlying Y metric
Within each band, there's a mild negative slope, but the dominant visual pattern is the between-band separation rather than a continuous negative trend — the linear model (y = -0.1339x + 15,254.7) is likely oversimplifying a more complex, possibly piecewise or threshold-driven relationship.
4. Confounding Factors and Caveats
Several caveats are critical here: - Time confound: Both series span 2017–2026, a period of massive crypto market evolution (bull/bear cycles, ETH's Merge transition from PoW to PoS in 2022, halving cycles for BTC). Any shared temporal trend (e.g., both declining or diverging during bear markets) can produce spurious correlation without direct causal linkage. - Non-stationarity: Both BTC price and Ethereum network metrics are known to be non-stationary time series with trends, volatility clustering, and structural breaks — standard Pearson r and Granger tests assume linearity and can be distorted by non-stationarity if not properly differenced. - Mismatched variable types: X is a price-based metric (BTC OHLCV-derived) while Y is a network/issuance metric for a different asset (ETH) — the mechanical linkage is indirect at best, mediated by broader market sentiment, macro liquidity, or correlated speculative flows across crypto assets. - The Merge event: If Y (IssTotNtv, likely ETH issuance) reflects Ethereum's supply issuance, the 2022 Merge drastically changed ETH's issuance rate (~90% reduction), which could single-handedly explain much of the banding structure and any "causality" — this is a structural break, not organic prediction.
5. Actionable Insights and Further Investigation
Given the banding, the analysis should be repeated with data segmented by known regime periods (pre/post-Merge, per BTC halving cycle) to check if the negative correlation is an artifact of pooling structurally distinct eras. Detrending or differencing both series to remove long-term trends before computing correlation and Granger tests would better isolate genuine short-term dynamic relationships. Additionally, given the unexpected Y→X causality direction, researchers should investigate whether ETH issuance changes serve as a leading indicator for broader market liquidity/sentiment shifts that subsequently affect BTC price — but should also test with additional lag structures and out-of-sample validation before treating this as a tradable signal, since spurious Granger causality is common in non-stationary financial time series.
X dataset: CryptoDataDownload – Binance BTC/USDT Daily OHLCV
Y dataset: Ethereum Historical Data (Daily)
Part of experiment: Bitcoin - CryptoDataDownload – Binance BTC/USDT Daily OHLCV vs Ethereum Historical Data (Daily)