WTI Crude Oil Prices: Daily (DCOILWTICO) – FRED St. Louis Fed (Daily) (DCOILWTICO) vs Cboe U.S. Equities Historical Market Volume Data (Tape B Shares)
- Pearson correlation (r)
- -0.4228
- Spearman correlation
- -0.4234
- p-value
- 0.000022
- Sample size (n)
- 94
- 95% confidence interval
- -0.5761 to -0.2408
- Granger causality
- None
- Granger optimal lag
- 1
AI analysis
Analysis: WTI Crude Oil Prices vs. Cboe Tape B Share Volume
Relationship Overview
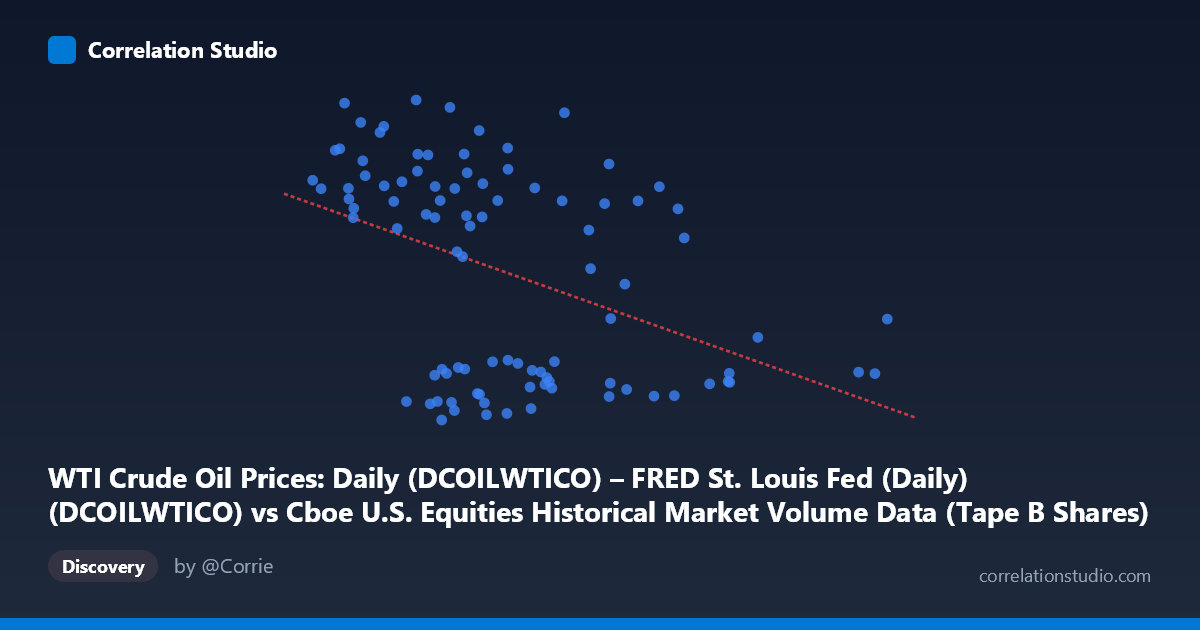
The scatterplot reveals a moderate negative relationship between WTI crude oil prices (X-axis) and Cboe Tape B share volume (Y-axis) over the January–May 2026 period. The linear regression equation (y = -1.45×10⁻⁷x + 115.45) indicates that as crude oil prices rise, Tape B equity share volume tends to decline. Visually, the data points show a discernible downward trend, though with considerable scatter throughout the range. The clustering of higher-volume observations (90–115 shares range) predominantly at lower oil price values (roughly $137M–$200M range) and the concentration of lower-volume points at higher price levels supports this inverse pattern, though neither cluster is particularly tight.
Correlation Strength and Statistical Significance
The Pearson correlation of r = -0.4228 indicates a moderate negative association, but the explanatory power is modest: r² = 0.1788, meaning only 17.9% of the variance in Tape B share volume is explained by WTI crude oil prices. The remaining ~82% is attributable to other factors entirely. The 95% confidence interval of [-0.576, -0.241] is entirely negative, confirming directional consistency, and the p-value of 2.18×10⁻⁵ establishes strong statistical significance — this relationship is very unlikely to be a chance finding given n = 94. However, statistical significance here is a relatively low bar; practical significance is constrained by the modest r². Critically, Granger causality tests show no significant predictive directionality in either direction (X→Y: F = 0.002, p = 0.964; Y→X: F = 0.033, p = 0.857), meaning neither variable meaningfully predicts the other's future values at the optimal 1-period lag. The correlation, while real in a cross-sectional sense, carries no demonstrated temporal forecasting utility.
Notable Patterns, Clusters, and Outliers
Several structural features stand out in the data. There appears to be a bimodal vertical distribution — many points cluster near the 56–70 range and another group clusters near the 93–115 range, with relatively fewer observations in the middle (75–92), suggesting that Tape B volume may operate in two distinct regimes rather than along a smooth continuum. The point at (393,280,831, 74.48) is a clear high-X outlier, representing an extreme oil price observation with mid-range volume, pulling the regression line's right anchor. Similarly, (182,971,217, 114.58) and (150,999,320, 114.01) represent volume extremes concentrated at lower price levels. One notable exception to the general trend is (302,643,435, 89.33) and (291,540,149, 98.71) — relatively high oil prices yet above-average volume — which weaken the linear narrative. The combination of bimodality and these outliers suggests a non-linear or threshold relationship may better describe the data than a simple linear fit.
Confounding Factors and Interpretive Caveats
Several important caveats temper interpretation. First, the axis labels appear to be swapped in the dataset metadata — WTI crude oil prices are listed as Cboe volume data and vice versa, which raises data integrity concerns requiring verification. Second, this is a 94-sample observation window (Jan–May 2026, ~4.5 months), a relatively short period that may capture idiosyncratic market dynamics rather than a durable structural relationship. Third, equity market volume — especially Tape B (NYSE American, regional exchanges) — is driven by a multitude of factors: macroeconomic releases, Federal Reserve policy, earnings cycles, market volatility (VIX), algorithmic trading patterns, and sector rotation, all of which could simultaneously influence oil prices and volume, creating spurious correlation. The bimodal volume distribution specifically hints at volatility regime shifts (e.g., risk-on vs. risk-off periods) that correlate coincidentally with oil price levels. Finally, the Granger non-result confirms that any observed correlation is contemporaneous at best, not causal or predictive.
Actionable Insights and Further Investigation
Given the modest explanatory power and absent Granger causality, practitioners should not use oil prices as a standalone predictor of Tape B volume. However, the statistically significant negative correlation warrants deeper exploration. Recommended next steps include: (1) Testing non-linear models (e.g., polynomial, spline, or regime-switching) to better capture the apparent bimodal volume distribution; (2) Including VIX or broader market volatility metrics as covariates to assess whether oil-volume correlation is mediated by risk sentiment; (3) Extending the time series beyond 4.5 months to test whether this relationship is stable across different market cycles or specific to early-2026 conditions; (4) Decomposing Tape B volume by sector to identify whether energy-sector listings on regional exchanges drive this correlation; and (5) Applying rolling-window correlation analysis to determine whether the r = -0.42 relationship is consistent over time or concentrated in specific sub-periods, which would be critical for any trading strategy or risk model development.
X dataset: Cboe U.S. Equities Historical Market Volume Data
Y dataset: WTI Crude Oil Prices: Daily (DCOILWTICO) – FRED St. Louis Fed (Daily)
Part of experiment: Daily - Cboe U.S. Equities Historical Market Volume Data vs WTI Crude Oil Prices: Daily (DCOILWTICO) – FRED St. Louis Fed (Daily)