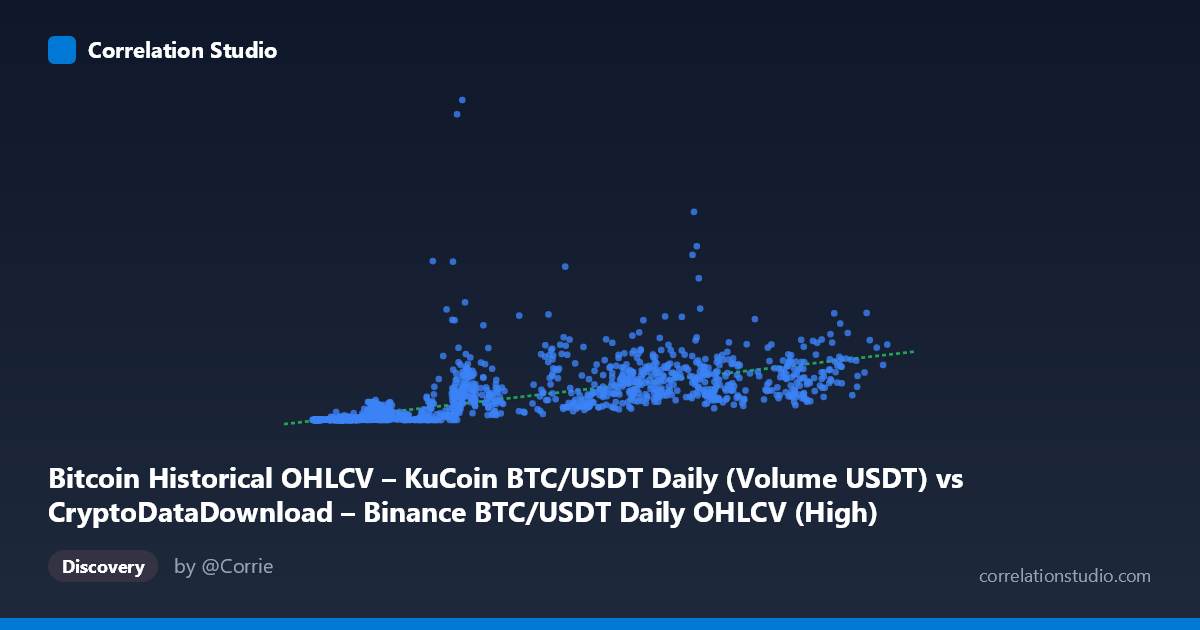
Bitcoin Historical OHLCV – KuCoin BTC/USDT Daily (Volume USDT) vs CryptoDataDownload – Binance BTC/USDT Daily OHLCV (High)
- Pearson correlation (r)
- 0.6867
- Spearman correlation
- 0.8687
- p-value
- 0
- Sample size (n)
- 1861
- 95% confidence interval
- 0.6619 to 0.71
- Granger causality
- None
- Granger optimal lag
- 10
AI analysis
Analysis: Trading Volume vs. Price Range (Bitcoin BTC/USDT)
1. What the Visualization Reveals
The scatterplot depicts the relationship between daily trading volume (X) and a derived high-price/volatility-like metric (Y) for BTC/USDT across ~5 years of daily data. The data shows a clear positive association: as volume increases, Y tends to increase as well, but the relationship is far from a tight linear band. Instead, the spread widens substantially at higher volume levels, producing a classic "funnel" or heteroscedastic pattern rather than a uniform linear cloud. This is reinforced by the metadata note that Spearman's rank correlation exceeds Pearson's r — a strong signal that the true relationship is curved (likely logarithmic or power-law) rather than linear, and/or that variance is non-constant across the range.
2. Strength, Direction, and Statistical Confidence
The Pearson correlation (r = 0.687) indicates a moderate-to-strong positive relationship, with r² = 0.472 meaning that only 47% of the variance in Y is explained by X in a linear framework — leaving more than half unexplained by volume alone. The 95% CI [0.662, 0.710] is tight, and the p-value is essentially 0, so we can be highly confident this correlation is real and not a sampling artifact, given n=1,861. However, statistical significance describes confidence in the existence of an association, not its causal direction or predictive utility. The Granger causality tests (optimal lag = 10 days) show no significant predictive relationship in either direction (X→Y: p=0.59; Y→X: p=0.77). This is an important caveat: despite the contemporaneous correlation, neither variable helps forecast future values of the other over a 10-day horizon — the co-movement appears to be simultaneous/contemporaneous rather than lead-lag.
3. Notable Patterns and Outliers
Several features stand out in the sample data: - Non-linear curvature: Low-volume days (X < 10,000) cluster tightly near very low Y values (often under 10 million), while mid-to-high volume days (X 30,000) show Y values ranging from ~150M to over 2.5 billion — consistent with a convex/exponential-like relationship rather than a straight line. - High-variance outlier: The point (32,162.59, 1,237,284,954.74) is a striking outlier — a moderate volume value paired with an exceptionally high Y, roughly 3-5x higher than neighboring points with similar X. This likely corresponds to a high-volatility event (e.g., a crash or parabolic rally day). - Regime clustering: The data seems to separate into low-volume/low-Y regime (X<10k, likely 2017-2019 bear/accumulation market) and high-volume/high-Y regime (X30k, likely 2020-2021 bull run), suggesting the correlation may partly reflect two distinct market epochs rather than a single continuous functional relationship.
4. Confounding Factors and Caveats
Several caveats limit causal interpretation: - Temporal/trend confounding: Both volume and price-derived metrics trended upward over 2017-2022 alongside Bitcoin's overall market maturation, market cap growth, and increased exchange adoption. This shared time trend can inflate correlation without implying direct mechanical linkage. - Definitional overlap: Y (KuCoin High price feed) and X (Binance Volume in USDT) are both derived from the same underlying asset (BTC/USDT) across correlated exchanges. Price and volume are jointly endogenous market variables — both driven by common underlying factors (volatility, news, liquidations, macro sentiment) rather than one causing the other. - Heteroscedasticity violates a key OLS assumption, meaning the reported r²/linear regression (y = 8,108.86x − 3.31E7) understates the true relationship strength and may produce poor/negative predictions at low volume (note the negative intercept). - Non-stationarity: Both series likely have unit roots/trends (typical of price and volume data), which can produce spurious correlation in level space; the Granger test not finding causality supports treating this as a spurious or contemporaneous-trend-driven correlation rather than a mechanistic one.
5. Actionable Insights
- Re-fit with a non-linear model: Given the Spearman/Pearson divergence and visual funnel shape, log-log regression (log(Y) ~ log(X)) or polynomial fit is likely to explain substantially more variance and produce more stable residuals. - Investigate the outlier: The (32,162, 1.24B) point warrants isolation — cross-check against known BTC volatility events (e.g., May 2021 crash, FTX collapse Nov 2022) to determine if it's a data anomaly or genuine extreme event. - Difference/detrend the series: Since Granger causality on levels showed nothing, re-run causality tests on log-differenced (returns/% change) series to check for lead-lag relationships in volatility/volume shocks, which is more standard in financial econometrics (e.g., testing the volume-volatility "clustering" hypothesis). - Segment by market regime: Splitting the dataset into bull/bear/sideways periods (via a regime-detection or simple date cutoff) could clarify whether the volume-Y relationship is stable or regime-dependent, informing whether pooled correlation understates or overstates the true within-regime relationship.
X dataset: CryptoDataDownload – Binance BTC/USDT Daily OHLCV
Y dataset: Bitcoin Historical OHLCV – KuCoin BTC/USDT Daily
Part of experiment: Bitcoin - CryptoDataDownload – Binance BTC/USDT Daily OHLCV vs Bitcoin Historical OHLCV – KuCoin BTC/USDT Daily