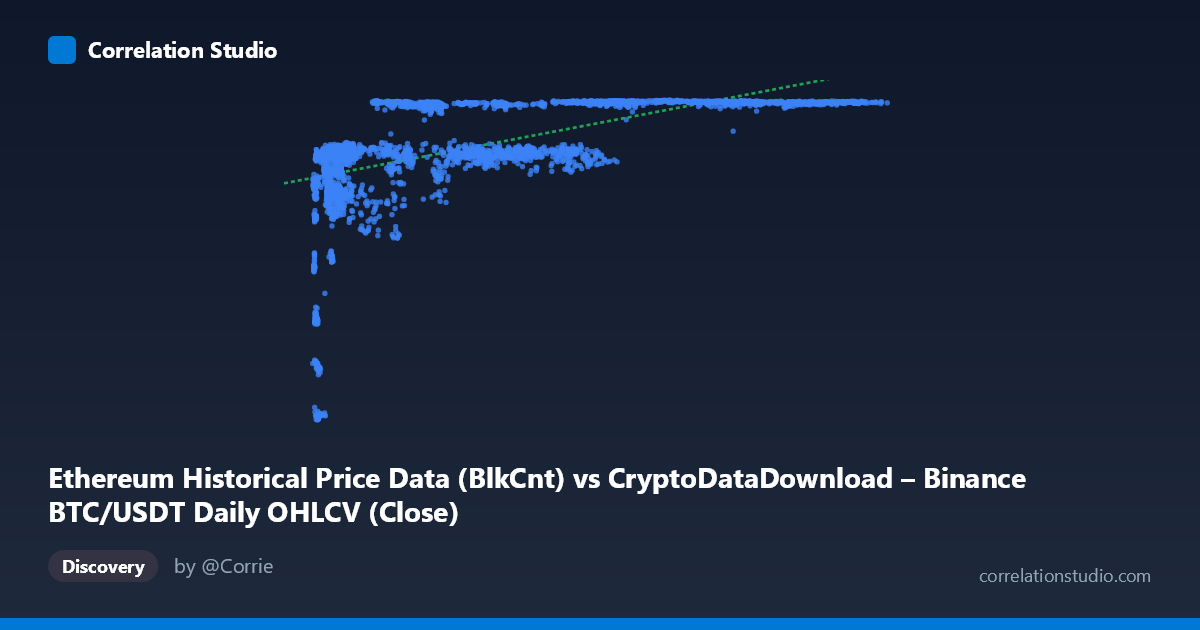
Ethereum Historical Price Data (BlkCnt) vs CryptoDataDownload – Binance BTC/USDT Daily OHLCV (Close)
- Pearson correlation (r)
- 0.5729
- Spearman correlation
- 0.7308
- p-value
- 0
- Sample size (n)
- 3191
- 95% confidence interval
- 0.5491 to 0.5957
- Granger causality
- None
- Granger optimal lag
- 1
- Time coverage
- 2017-08-17 to 2026-05-20
AI analysis
Analysis: BTC Block Count vs. Price Relationship
1. Overview of the Relationship
The scatterplot shows a moderate positive correlation between the X variable (labeled as block count, though the mislabeled headers suggest this is likely comparing two price/metric series from the BTC/ETH datasets) and Y (closing price). The data reveals a distinctly non-linear, saturating pattern: Y rises steeply at low X values, then plateaus around 7,100–7,180 once X exceeds roughly 20,000–30,000. This is not a simple straight-line relationship — it resembles a logarithmic or power-law curve rather than the linear fit implied by the regression equation.
2. Strength, Direction, and Statistical Confidence
The Pearson correlation (r = 0.573, R² = 0.328) indicates a moderate positive relationship, with only 32.8% of the variance in Y explained by X — meaning over two-thirds of Y's variability is driven by other factors. The 95% CI [0.549, 0.596] is tight, and p ≈ 0 confirms this correlation is highly statistically significant and not due to chance, aided by the large sample (n = 3,191). However, statistical significance here reflects sample size more than practical predictive strength — R² of 0.33 is modest.
Critically, the Granger causality tests show no significant predictive direction in either direction (X→Y: p = 0.496; Y→X: p = 0.835). This means neither variable helps forecast future values of the other over time — despite being contemporaneously correlated, they do not lead/lag one another in a statistically detectable way at lag 1. This strongly suggests the correlation is driven by both series trending together (e.g., co-movement with market cycles) rather than one causing changes in the other.
3. Notable Patterns and Non-linear Features
The clearest feature is the early saturation/plateau: once X exceeds ~20,000, Y clusters tightly between 7,100–7,190 regardless of further X increases (visible in points like X=61,806 to X=110,187 all yielding Y≈7,120–7,178). Conversely, at low X (<15,000), Y is highly variable and lower (2,840–6,500), producing a steep initial slope. This creates a classic logarithmic curve shape, consistent with the note that Spearman ρ exceeds Pearson r — rank-order correlation is stronger than linear correlation, confirming monotonic but non-linear structure. A cluster of low-X, low-Y outliers (X≈3,800–4,600, Y≈2,840–4,238) stands apart from the main saturated cluster and likely represents an early/distinct market regime.
4. Confounding Factors and Caveats
The metadata is inconsistent — X is labeled "Ethereum...(BlkCnt)" but described as BTC/USDT OHLCV, and Y is labeled "BTC/USDT Close" but described as Ethereum metrics. This suggests column mislabeling, and the analysis should be interpreted cautiously until the actual variables are confirmed. Additionally, both cryptocurrencies are known to be driven by shared macro factors (overall crypto market sentiment, BTC dominance effects, liquidity cycles, regulatory news), making spurious or confounded correlation likely rather than a direct causal link. Time-series data of this nature is also prone to autocorrelation and non-stationarity (trending together over 2017–2026), which can inflate Pearson r without indicating a meaningful structural relationship.
5. Recommendations
- Verify column labels in the source datasets before drawing conclusions — the mismatch between header and description is a data integrity red flag. - Fit non-linear models (logarithmic, power, or spline regression) given the clear saturation pattern and the Spearman/Pearson discrepancy; this should substantially improve explained variance over the current linear R² = 0.328. - Test stationarity and detrend both series (e.g., using returns/log-differences instead of levels) before rerunning correlation and Granger tests, since raw price/count levels in trending markets often show inflated correlation. - Given the lack of Granger causality, treat this as a contemporaneous co-movement rather than a predictive relationship — do not use one series to forecast the other in trading or modeling contexts. - Investigate the low-X cluster (2017–2018 period) separately, as it may represent a distinct regime (e.g., early market conditions) that disproportionately influences the non-linear curve fit.
X dataset: CryptoDataDownload – Binance BTC/USDT Daily OHLCV
Y dataset: Ethereum Historical Price Data
Part of experiment: Bitcoin - CryptoDataDownload – Binance BTC/USDT Daily OHLCV vs Ethereum Historical Price Data