VIX Volatility Index Daily (FRED) (VIXCLS) vs Cboe U.S. Equities Historical Market Volume Data 2010 (Tape B Trade Count)
- Pearson correlation (r)
- 0.7426
- Spearman correlation
- 0.5866
- p-value
- 0
- Sample size (n)
- 252
- 95% confidence interval
- 0.6816 to 0.7934
- Granger causality
- Y → X
- Granger optimal lag
- 1
AI analysis
Analysis: VIX Volatility Index vs. Cboe Tape B Trade Count (2010)
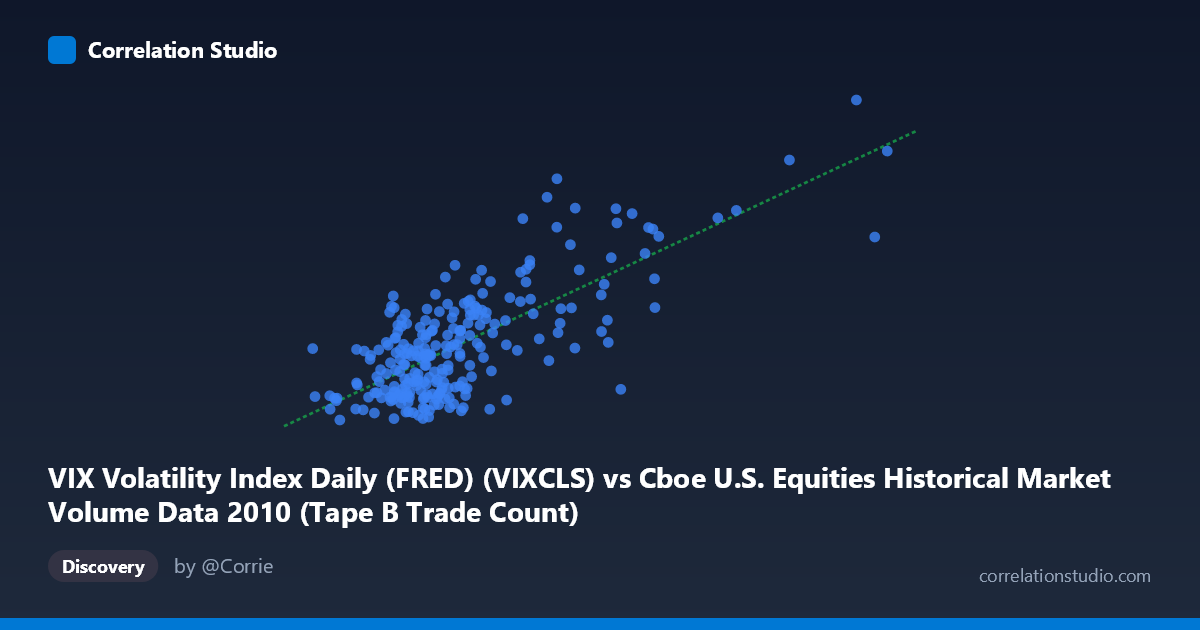
Relationship Overview The scatterplot reveals a moderately strong positive relationship between the VIX Volatility Index and Cboe U.S. Equities Tape B Trade Count throughout 2010. As the VIX rises — indicating greater implied volatility and market fear — the number of Tape B trades increases correspondingly. This is economically intuitive: periods of heightened uncertainty tend to drive elevated trading activity as market participants react to news, rebalance portfolios, hedge positions, or capitalize on short-term price dislocations. The linear regression equation (y = 3.09e-05x + 13.17) suggests that for every unit increase in market volume, the VIX increases by a small but consistent increment, though the directionality of interpretation warrants caution given the Granger causality findings.
Correlation Strength and Statistical Significance The Pearson correlation of r = 0.743 reflects a meaningful positive association, and the R² of 0.5515 indicates that approximately 55% of the variance in VIX is explained by Tape B trade count — a substantial explanatory share for a single-variable model in financial data, though it equally implies ~45% of variance remains unexplained by this relationship alone. The 95% confidence interval of [0.682, 0.793] is relatively narrow given the sample of 252 paired observations, lending confidence that this is a genuine and stable relationship rather than a statistical artifact. The p-value of effectively zero confirms the result is highly statistically significant. Crucially, the Granger causality analysis points unidirectionally: Y (VIX) Granger-causes X (Trade Volume) at a 1-period lag (F = 7.10, p = 0.008), while the reverse direction (X→Y) falls just short of significance (F = 3.83, p = 0.051). This suggests that yesterday's VIX reading has predictive power over today's trade volume, but not strongly vice versa — implying fear precedes activity, not the other way around.
Patterns, Clusters, and Outliers The scatterplot displays a recognizable heteroscedastic fan shape: observations cluster densely at lower VIX values (roughly 15–25) and lower trade counts (roughly 100,000–350,000), with the distribution spreading considerably as both variables increase. Several notable high-leverage outliers appear in the upper-right region, including points near (918,660; 40.95) and (778,566; 40.10), which correspond to days of extreme market stress where both volatility and trading volume spiked simultaneously — likely associated with specific macro events in 2010 such as the May 6 Flash Crash or European sovereign debt contagion episodes. A handful of moderate-volume days also show elevated VIX (e.g., ~445,597 volume at VIX 38.32), suggesting episodic spikes not fully captured by the linear trend. Below VIX ~20, the relationship appears considerably noisier, indicating that in calm markets, trade count is less reliably predicted by volatility.
Confounding Factors and Caveats Several confounds deserve attention. First, both variables are driven by common macro shocks (e.g., policy announcements, geopolitical events), meaning the correlation may reflect co-movement in response to a third factor rather than any direct causal mechanism between VIX and Tape B volume specifically. Second, Tape B specifically captures NYSE American and regional exchange activity, which may respond differently to volatility than the broader market — the relationship could look quite different for Tape A (NYSE) or Tape C (Nasdaq) data. Third, the dataset spans only one calendar year (2010), a period that included unusual tail-risk events; the correlation may not generalize to lower-volatility regimes such as 2017. Fourth, while Granger causality identifies a predictive temporal pattern, it does not establish structural causality — the lag-1 relationship may be mediated by algorithmic trading responses, ETF rebalancing flows, or options market activity that this bivariate framework cannot disentangle.
Actionable Insights and Further Investigation Practitioners could explore using lagged VIX as a short-term predictor of next-day trade volume for execution planning — the Granger result suggests this signal has edge, particularly for days following significant volatility spikes. For researchers, it would be worthwhile to segment the analysis by market regime (e.g., VIX above/below 20) to test whether the relationship is primarily driven by stress episodes or holds in normal conditions. Extending the dataset beyond 2010 would strengthen generalizability and allow testing across multiple volatility cycles. A multivariate model incorporating additional features (e.g., S&P 500 returns, bid-ask spreads, Tape A/C volumes) could substantially improve explanatory power beyond the current 55% R². Finally, examining whether the VIX→Volume relationship persists at intraday resolution could yield more actionable signals for high-frequency trading or liquidity provision strategies.
X dataset: Cboe U.S. Equities Historical Market Volume Data 2010
Y dataset: VIX Volatility Index Daily (FRED)
Part of experiment: Daily - Cboe U.S. Equities Historical Market Volume Data 2010 vs VIX Volatility Index Daily (FRED)