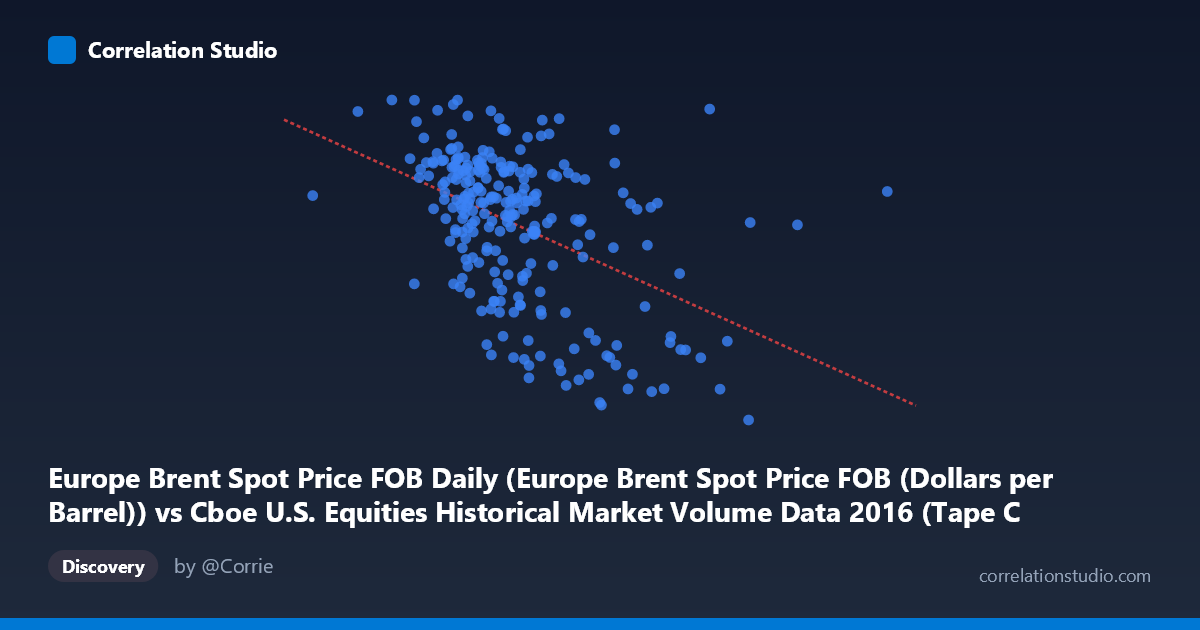
Europe Brent Spot Price FOB Daily (Europe Brent Spot Price FOB (Dollars per Barrel)) vs Cboe U.S. Equities Historical Market Volume Data 2016 (Tape C Notional)
- Pearson correlation (r)
- -0.46
- Spearman correlation
- -0.466
- p-value
- 0
- Sample size (n)
- 251
- 95% confidence interval
- -0.5524 to -0.3565
- Granger causality
- None
- Granger optimal lag
- 1
AI analysis
Analysis: Europe Brent Spot Price vs. Cboe Tape C Notional Value (2016)
Relationship Overview The scatterplot reveals a moderate negative relationship between Europe Brent crude oil spot prices (X-axis, in dollars per barrel) and Cboe Tape C notional trading volume (Y-axis). As Brent crude prices increase, Tape C notional value tends to decline, and vice versa. The linear regression equation (y = -2.70×10⁻⁹x + 57.14) confirms this inverse slope, though the scatter around the regression line is substantial, indicating the relationship is real but far from deterministic. Visually, the data cloud shows a downward-trending envelope with considerable dispersion throughout the mid-range of X values.
Correlation Strength and Statistical Significance The Pearson correlation of r = -0.46 indicates a moderate negative association. Crucially, the coefficient of determination r² = 0.2116 means only ~21% of the variance in Tape C notional is explained by Brent crude prices — leaving roughly 79% of variability unexplained by this relationship alone. The 95% confidence interval of [-0.55, -0.36] is entirely negative and does not cross zero, and the p-value of 1.51×10⁻¹⁴ confirms the correlation is highly statistically significant across the full population (N = 3,622). However, statistical significance here reflects the large sample size amplifying detection power; the practical magnitude remains modest. Notably, Granger causality tests find no significant predictive directionality in either direction (X→Y: F = 0.21, p = 0.65; Y→X: F = 0.21, p = 0.64), meaning neither variable meaningfully predicts the other's future values at the tested lag. This is a critical caveat: the correlation is contemporaneous but not temporally predictive.
Patterns, Clusters, and Outliers Several notable structural features emerge from the sample points: - A dense cluster forms in the X range of roughly 3.9–5.2 billion (corresponding to moderate oil prices ~$40–50/barrel), where Y values are broadly distributed from ~37 to 54, suggesting high variability in notional volume at typical oil price levels. - Low-X outliers (e.g., the point near 1.9 billion) and high-X outliers (notably ~8.5 billion at Y = 26.01, and points around 7.3 billion at Y ≈ 33) drive much of the negative correlation — these extreme observations appear to be influential leverage points pulling the regression line. - There is a visible cluster of high-Y values (~48–54) concentrated in the lower-to-middle X range (~3.4–5.0 billion), and a distinct low-Y cluster (~26–34) at very high X values, reinforcing the inverse pattern but suggesting possible bimodal or non-linear structure rather than a smoothly linear relationship. - The regression may be overly simplified for this data; a quadratic or piecewise fit might better capture the apparent curve in the point cloud.
Confounding Factors and Caveats Several important caveats apply. First, 2016 was a structurally unusual year for both oil markets (OPEC production negotiations, price recovery from multi-year lows) and U.S. equities markets (Brexit volatility, U.S. election), meaning the observed relationship may be period-specific and non-generalizable. Second, common third-variable drivers — such as macroeconomic uncertainty, risk-off/risk-on sentiment, or USD strength — could simultaneously suppress oil prices and redistribute equity trading volumes, creating a spurious or mediated correlation rather than a direct one. Third, Tape C specifically covers NYSE Arca-listed securities (notably ETFs), and oil-price-sensitive ETF flows could mechanically link these variables without implying a broader market relationship. Finally, the absence of Granger causality suggests the correlation is likely contemporaneous and driven by shared external shocks rather than one variable leading the other.
Actionable Insights and Further Investigation Despite the absence of Granger causality, the statistically robust negative correlation warrants further investigation. Analysts should consider: (1) decomposing Tape C notional volume by security type (ETFs vs. equities) to test whether oil-linked ETF flows specifically drive the relationship; (2) controlling for VIX or macroeconomic surprise indices to isolate whether this correlation survives after accounting for general risk sentiment; (3) testing non-linear model fits (e.g., quadratic regression or regime-switching models) given the apparent clustering structure; and (4) extending the analysis beyond 2016 to assess whether the relationship is structurally persistent or an artifact of that year's unique oil price recovery cycle. The ~21% explained variance is meaningful enough to include Brent prices as a secondary covariate in equity volume forecasting models, but insufficient to use as a standalone predictor.
X dataset: Cboe U.S. Equities Historical Market Volume Data 2016
Y dataset: Europe Brent Spot Price FOB Daily
Part of experiment: Daily - Cboe U.S. Equities Historical Market Volume Data 2016 vs Europe Brent Spot Price FOB Daily