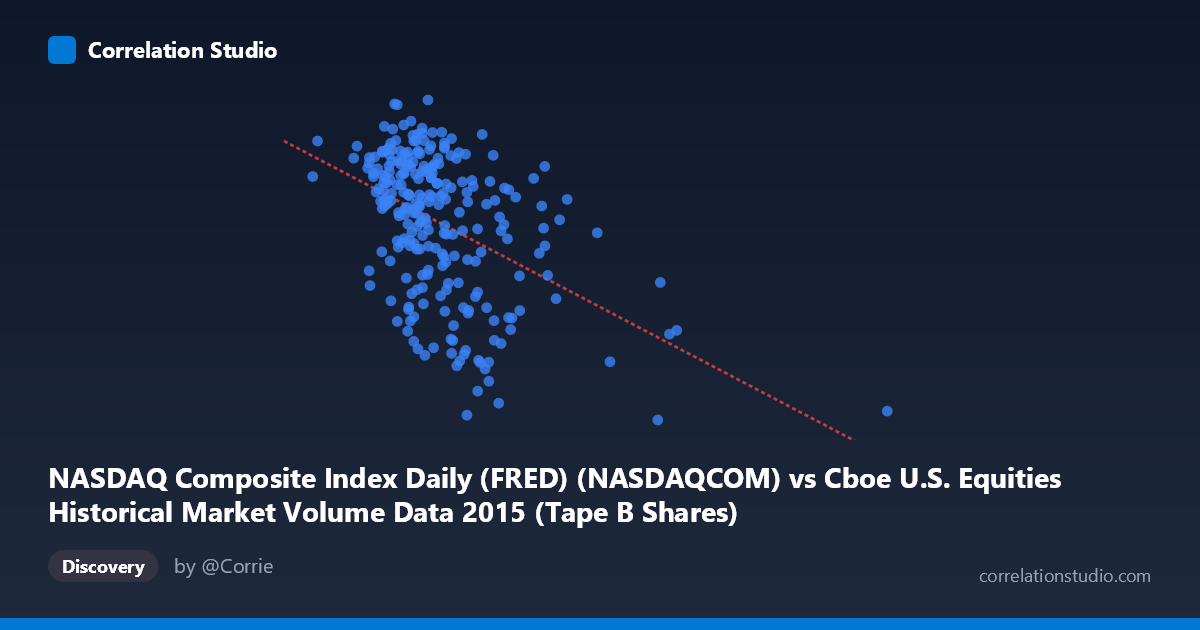
NASDAQ Composite Index Daily (FRED) (NASDAQCOM) vs Cboe U.S. Equities Historical Market Volume Data 2015 (Tape B Shares)
- Pearson correlation (r)
- -0.4563
- Spearman correlation
- -0.4298
- p-value
- 0
- Sample size (n)
- 252
- 95% confidence interval
- -0.5489 to -0.3526
- Granger causality
- None
- Granger optimal lag
- 10
AI analysis
Analysis: NASDAQ Composite Index vs. Cboe Tape B Share Volume (2015)
Relationship Overview The scatterplot reveals a negative relationship between NASDAQ Composite Index levels and Cboe Tape B share volume throughout 2015. As the index climbed higher, trading volume in Tape B securities (primarily NYSE American/AMEX-listed stocks) tended to decline. This inverse pattern is visually apparent across the data cloud, with higher index values (above ~150M notional range on the x-axis) clustering toward lower Y values, while the denser concentration of points at lower x-values spans a broader and generally higher range of Tape B share volumes. The linear regression equation y = -2.51×10⁻⁶x + 5205.1 quantifies this slope, indicating that for every 100 million unit increase in the NASDAQ index level, Tape B volume decreases by roughly 250 shares (in the reported units).
Correlation Strength and Statistical Significance The Pearson correlation of r = -0.456 indicates a moderate negative association, but the explanatory power is meaningfully limited: R² = 0.208, meaning only about 20.8% of the variance in Tape B volume is accounted for by NASDAQ index levels. Nearly 80% of the variation remains unexplained by this linear relationship alone. The 95% confidence interval of [-0.549, -0.353] is entirely negative and does not include zero, lending credibility to the directional finding. The p-value of 2.31×10⁻¹⁴ confirms this correlation is highly statistically significant given a sample of 252 paired observations drawn from a population of 3,302 — making a chance result extraordinarily unlikely. However, statistical significance here is partly a function of sample size, and the modest R² should temper practical enthusiasm. Critically, the Granger causality tests show no significant predictive directionality in either direction (X→Y: F=1.87, p=0.051; Y→X: F=0.70, p=0.72), meaning that past values of the NASDAQ index do not reliably predict future Tape B volume and vice versa. The X→Y result sits tantalizingly close to the 0.05 threshold but does not cross it, suggesting at best a weak, borderline temporal signal that should not be treated as actionable.
Notable Patterns, Clusters, and Outliers Several features stand out in the data. The bulk of observations concentrate in the x-range of roughly 65M–130M, forming a relatively diffuse cloud that itself shows considerable vertical scatter — Tape B volume ranges from below 4,700 to above 5,200 within this central band, highlighting the noise in the relationship. A visible cluster of lower-right outliers appears at high x-values (around 130M–215M), consistently associated with lower Tape B volumes (4,506–4,706), including notably extreme points near (205M, 4,506) and (213M, 4,706). These high-volume/low-Tape-B-share points may correspond to periods of broad market rallies in mid-to-late 2015 when capital rotated away from smaller-cap Tape B securities. Conversely, several high Tape B readings (above 5,200, e.g., ~5,218 and ~5,210) appear at moderate x-values (~82M–98M), potentially corresponding to periods of market stress or sector-specific activity. The relationship does not appear strongly non-linear, but the scatter is wide enough that a linear model is a rough approximation at best.
Confounding Factors and Interpretive Caveats Several important caveats apply. First, this is a temporal dataset spanning a single calendar year (2015), and both series are influenced by the same macro calendar — market events, Federal Reserve communications (particularly the December 2015 rate hike), summer volatility, and the August 2015 flash crash could drive correlated movements in both series simultaneously without implying a structural relationship. Second, Tape B volume is exchange-specific (covering NYSE American/regional exchanges), so its behavior may reflect routing decisions, competitive dynamics among exchanges, and regulatory changes rather than fundamental reactions to the NASDAQ composite level. Third, the NASDAQ composite is a price index, not a volume measure, so comparing it to a volume series mixes conceptually distinct financial quantities — the negative correlation may largely reflect a risk-off/risk-on rotation dynamic rather than a direct causal link. Fourth, autocorrelation in both daily financial time series likely inflates the effective sample size, potentially making the p-value appear more robust than it truly is.
Actionable Insights and Further Investigation Practitioners should resist over-interpreting the -0.456 correlation as a reliable trading or operational signal, given that Granger causality tests fail to confirm predictive utility. However, the moderate negative correlation does suggest a portfolio diversification or hedging angle worth probing: Tape B volume appears to partially move counter-cyclically to NASDAQ index levels, which could inform liquidity modeling for market makers and exchange operators. To deepen this analysis, it would be valuable to: (1) decompose the time series to remove shared macro trends and test the correlation on residuals; (2) extend the dataset beyond 2015 to test whether this relationship is stable across different market regimes, particularly post-COVID high-volume environments; (3) compare Tape A and Tape C volumes under the same framework to determine whether the pattern is specific to Tape B or reflects a broader multi-venue dynamic; and (4) incorporate volatility measures (e.g., VIX) as potential mediating variables that may explain much of the residual 79% variance. A regime-switching or quantile regression approach may also better capture the non-uniform spread visible across the scatterplot.
X dataset: Cboe U.S. Equities Historical Market Volume Data 2015
Y dataset: NASDAQ Composite Index Daily (FRED)
Part of experiment: Daily - Cboe U.S. Equities Historical Market Volume Data 2015 vs NASDAQ Composite Index Daily (FRED)