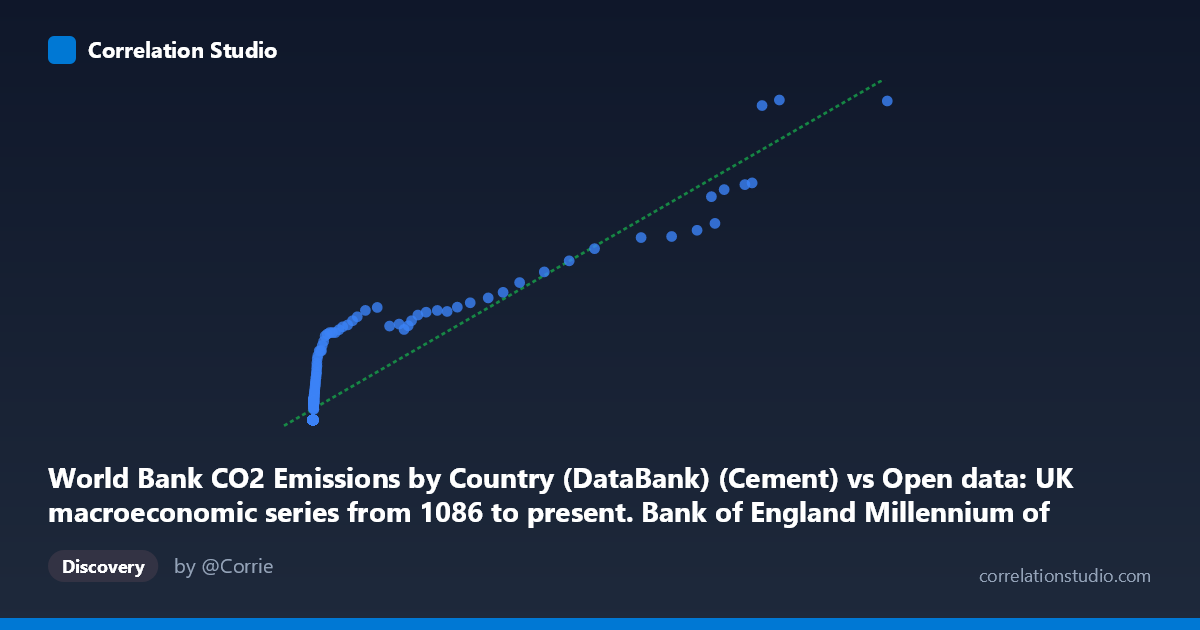
World Bank CO2 Emissions by Country (DataBank) (Cement) vs Open data: UK macroeconomic series from 1086 to present. Bank of England Millennium of Macroeconomic Data. (Month) (value)
- Pearson correlation (r)
- 0.9241
- Spearman correlation
- 0.8375
- p-value
- 0
- Sample size (n)
- 267
- 95% confidence interval
- 0.9043 to 0.9399
- Granger causality
- Y → X
- Granger optimal lag
- 10
- Time coverage
- 1751-01-01 to 2017-01-01
AI analysis
Analysis: UK Macroeconomic Data vs. World Bank CO2 Cement Emissions
Relationship Overview
The scatterplot reveals a strong positive relationship between World Bank CO2 cement emissions (X-axis) and UK macroeconomic values (Y-axis) spanning 1751–2017. The linear regression equation y = 0.0210783x + 80.4375 describes a gently sloping relationship with a substantial positive intercept, suggesting that even at near-zero cement emissions, the macroeconomic indicator maintains a baseline value around 80. The relationship is clearly non-linear in character despite a linear fit being applied — the data compresses heavily at low X values with a long right tail extending toward extreme emission figures exceeding 100,000 units, a pattern consistent with the dramatic right-skew evident in the X variable's mean (5,895) being far exceeded by its standard deviation (18,658).
Correlation Strength and Statistical Significance
The correlation is strong (r = 0.9241) and highly statistically significant (p ≈ 0), with a tight 95% confidence interval of [0.9043, 0.9399] confirming robustness across the full population of N = 18,769 observations. The r² of 0.8539 means approximately 85.4% of variance in the macroeconomic Y variable is explained by cement CO2 emissions, which is a remarkably high figure for cross-domain data spanning nearly three centuries. However, the Granger causality results introduce an important temporal nuance: Y Granger-causes X unidirectionally (F = 2.16, p = 0.021 at a 10-period lag), while X does not significantly predict Y (F = 1.63, p = 0.100). This reverses the intuitive causal narrative — it is the UK macroeconomic trajectory that appears to temporally precede cement emission changes, not the other way around, which aligns with the economic logic that industrial output and investment decisions drive material production.
Patterns, Clusters, and Outliers
The data exhibits a pronounced dual-cluster structure. A dense mass of points clusters near the origin (X < 500, Y = 0), representing years or entities with minimal cement emissions and zero or near-zero macroeconomic values — likely early historical periods or countries with negligible industrial activity. A second, more dispersed cluster spans the mid-to-high range (X: 1,000–50,000; Y: 300–1,100), showing reasonable linear tracking. Several notable outliers appear at extreme X values — the point at (116,836, 2,368) is the most extreme, potentially representing peak industrial-era or large-economy observations. The Y = 0 floor for many low-X observations strongly suggests censored or missing data rather than true zero values, which could artificially inflate the apparent correlation.
Confounding Factors and Caveats
Several caveats warrant serious caution. Spurious correlation driven by shared time trends is the primary concern: both global cement CO2 emissions and UK macroeconomic indicators grew substantially over the 1751–2017 period simply due to industrialization, population growth, and economic development — any two upward-trending series across this timeframe would correlate strongly. The mixing of cross-sectional and time-series data (country-level emissions joined with UK macro series) is methodologically irregular and may produce misleading r values. The large number of zero-Y observations suggests possible data alignment issues or gaps in the historical record. Additionally, the 10-period Granger lag is substantial and its economic interpretation is unclear without knowing whether periods represent years, decades, or months.
Actionable Insights and Further Investigation
Given the Granger causality finding, analysts should investigate whether UK economic expansions historically preceded global cement production booms, potentially through UK capital export, colonial industrial investment, or financial market leadership. Priority next steps include: (1) log-transforming both variables to address severe right-skew and test whether the relationship holds in proportional terms; (2) detrending both series using first-differences or HP filtering to isolate the correlation beyond shared secular trends; (3) segmenting analysis by era (pre-industrial, industrial, post-war, modern) to test structural breaks in the relationship; and (4) reconciling the dataset join methodology — pairing country-level CO2 data with UK-specific macro series requires careful entity matching to avoid spurious cross-country contamination. The high r² should be treated skeptically until trend confounding is formally addressed.
X dataset: Open data: UK macroeconomic series from 1086 to present. Bank of England Millennium of Macroeconomic Data. (Month)
Y dataset: World Bank CO2 Emissions by Country (DataBank)
Part of experiment: Yearly - Open data: UK macroeconomic series from 1086 to present. Bank of England Millennium of Macroeconomic Data. (Month) vs World Bank CO2 Emissions by Country (DataBank)