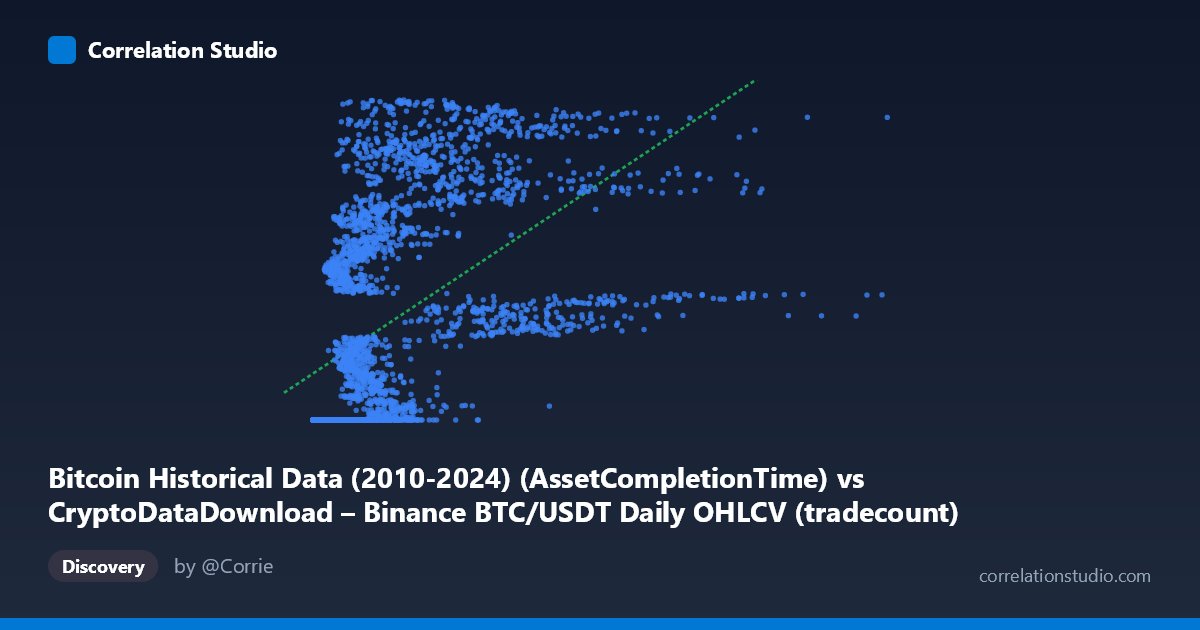
Bitcoin Historical Data (2010-2024) (AssetCompletionTime) vs CryptoDataDownload – Binance BTC/USDT Daily OHLCV (tradecount)
- Pearson correlation (r)
- 0.5264
- Spearman correlation
- 0.7892
- p-value
- 0
- Sample size (n)
- 3191
- 95% confidence interval
- 0.5009 to 0.5511
- Granger causality
- None
- Granger optimal lag
- 10
AI analysis
Analysis of the Relationship Between Two "Time-Like" Variables
1. What the Visualization Reveals
This scatterplot is unusual in that both axes appear to be proxies for time rather than independent measured variables. The X-axis label references "AssetCompletionTime" for Bitcoin OHLCV records, and the Y-axis is nominally a "tradecount" field but its values (1.6–1.78 billion) are far too large to be actual trade counts — they closely resemble Unix timestamps or another time-encoded index. The sample points confirm this: Y values cluster tightly around ~1,614,337,xxx for a large swath of small X values, then increase in a step-like, saturating pattern as X grows. This is not a typical bivariate scatter of independent metrics; it looks like a monotonic but non-linear mapping between two time-related fields, likely due to a data pipeline artifact (e.g., row-completion timestamps vs. record sequence numbers).
2. Strength, Direction, and Uncertainty
The Pearson correlation (r = 0.526, R² = 0.277) indicates a moderate positive linear relationship, with only ~28% of Y's variance explained by a linear fit in X. The 95% CI [0.501, 0.551] is narrow and the p-value is effectively 0, so we can be confident the linear association is real and not due to chance — but statistical significance here reflects the large sample size (n=3,191), not necessarily practical strength. Critically, Spearman's ρ exceeds Pearson's r, signaling that a monotonic non-linear relationship (log, power, or piecewise/step function) fits the data better than a straight line — consistent with the visual pattern of a flat plateau followed by a rising curve. The Granger causality tests (p = 0.447 and p = 0.657) show no significant predictive direction either way, meaning neither variable helps forecast the other's future values in a time-series sense. This reinforces that the "correlation" is likely structural/mechanical (both derived from timestamps or record order) rather than a causal or economically meaningful relationship.
3. Notable Patterns and Outliers
The most striking feature is a large flat cluster where Y ≈ 1,614,337,xxx across a wide range of small-to-moderate X values (roughly X < 2,000,000) — many rows share nearly identical Y values, differing only in the last few digits. This suggests these records were all stamped/processed at the same time or share a default/placeholder value. Beyond this plateau, Y rises steeply and somewhat noisily as X increases past ~2–9 million, eventually reaching the ceiling near 1.78 billion. This produces a hockey-stick or logarithmic-saturation curve, not a linear trend — explaining why R² is modest and Spearman ρ is higher than Pearson r. No classic "outliers" are evident; rather, the pattern reflects two distinct regimes (a saturated/constant regime and a rising regime).
4. Confounding Factors and Caveats
Given the field names and value ranges, the most likely confound is a data schema issue: X appears to be a row index, satoshi-scale value, or partial timestamp, while Y is almost certainly a Unix timestamp (1,614,337,105 = Feb 26, 2021; 1,779,332,997 = ~2026), mislabeled as "tradecount." If Y is genuinely a timestamp, computing Pearson/Spearman correlation or Granger causality against it is statistically inappropriate — timestamps aren't a "variable" that can be caused by or predictive of another data column in the usual sense. Any correlation here may simply reflect database insertion order or ETL batch processing artifacts, not a real Bitcoin market relationship. The mismatch between the described dataset (price/volume OHLCV) and the actual Y-axis behavior strongly suggests a column mapping or join error during data preparation.
5. Recommendations
1. Verify column semantics: Confirm whether the Y-axis "tradecount" field was correctly extracted — the value range strongly suggests it's a mis-tagged timestamp field, not trade counts. 2. Re-run the analysis with true variables: If tradecount and a genuine time/price column are desired, re-extract them from source and re-plot; the current chart doesn't answer any meaningful Bitcoin market question. 3. If the mapping is intentional, fit a non-linear model (logarithmic or piecewise) rather than linear regression, since Spearman ρ Pearson r and the visual pattern show clear saturation. 4. Investigate the flat cluster: Identify why thousands of records share Y ≈ 1,614,337,xxx — this may indicate a default/null timestamp bug during initial data ingestion (e.g., all early records stamped at pipeline start time). 5. Treat Granger results as informative: The lack of causality in either direction confirms these fields are not temporally predictive of one another, supporting the hypothesis that this is a data-quality artifact rather than a substantive economic relationship worth modeling further.
X dataset: CryptoDataDownload – Binance BTC/USDT Daily OHLCV
Y dataset: Bitcoin Historical Data (2010-2024)
Part of experiment: Bitcoin - CryptoDataDownload – Binance BTC/USDT Daily OHLCV vs Bitcoin Historical Data (2010-2024)