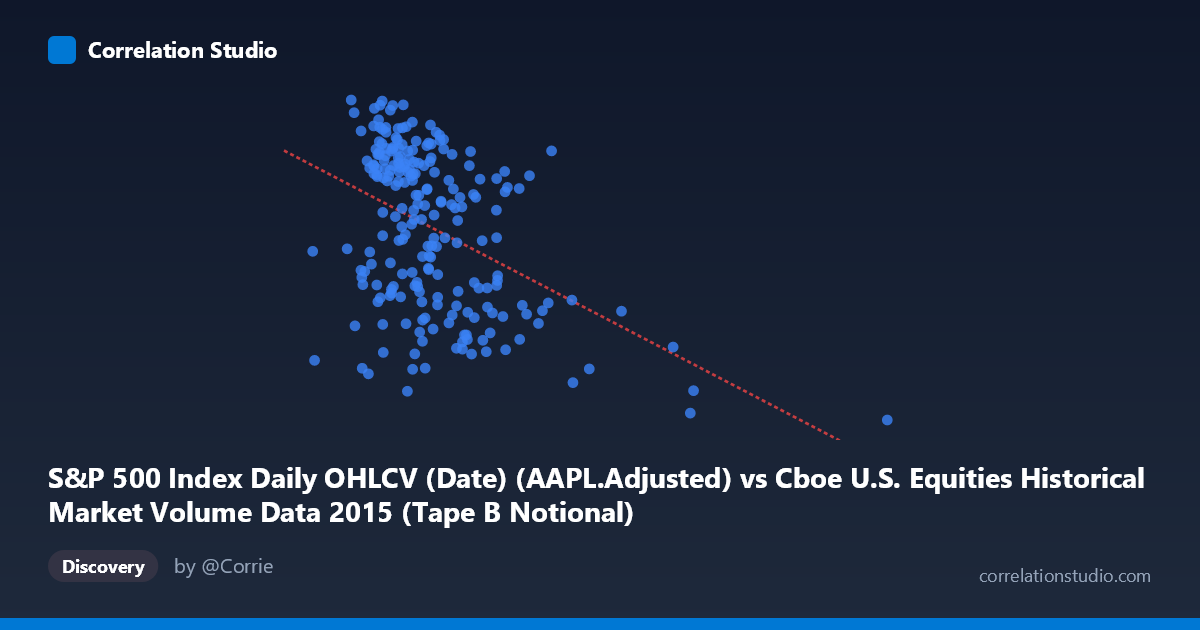
S&P 500 Index Daily OHLCV (Date) (AAPL.Adjusted) vs Cboe U.S. Equities Historical Market Volume Data 2015 (Tape B Notional)
- Pearson correlation (r)
- -0.434
- Spearman correlation
- -0.3924
- p-value
- 0
- Sample size (n)
- 222
- 95% confidence interval
- -0.5351 to -0.3206
- Granger causality
- None
- Granger optimal lag
- 1
AI analysis
Scatterplot Analysis: AAPL Adjusted Price vs. Cboe Tape B Notional Volume
Relationship Overview
The scatterplot reveals a negative relationship between AAPL's adjusted closing price (X-axis) and Cboe Tape B notional trading volume (Y-axis) across the 2015 trading year. As AAPL's price increases, Tape B notional volume tends to decline, and conversely, lower AAPL prices are associated with higher notional volume activity. The linear regression equation (y = -1.66E-09x + 125.782) confirms this inverse slope, suggesting that for every ~$600M increase in AAPL's adjusted price metric, Tape B notional volume decreases by roughly 1 unit. This pattern is broadly consistent with market dynamics where equity price drawdowns — particularly in a bellwether like AAPL — tend to coincide with elevated broad market trading activity driven by volatility and reactive repositioning.
Correlation Strength and Statistical Significance
The Pearson correlation of r = -0.434 indicates a moderate negative association, but the explanatory power is notably limited: R² = 0.1884 means only 18.8% of the variance in Tape B notional volume is explained by AAPL's price level, leaving over 80% attributable to other factors. The 95% confidence interval of [-0.535, -0.321] is entirely negative, confirming directional consistency, and the p-value of 1.304E-11 establishes the relationship as highly statistically significant — this is almost certainly not a chance finding given n = 222 paired observations. However, statistical significance should not be conflated with practical magnitude; the modest R² tempers enthusiasm for using AAPL price alone as a predictive tool for Tape B volume. Critically, Granger causality tests find no significant temporal predictive relationship in either direction (X→Y: F = 0.96, p = 0.33; Y→X: F = 0.16, p = 0.69), meaning that past AAPL prices do not meaningfully predict future Tape B notional volume and vice versa at a 1-period lag. The correlation reflects co-movement, not a leading-lagging predictive structure.
Notable Patterns, Clusters, and Outliers
Several structural features stand out. The bulk of observations cluster in the AAPL price range of ~$3.5B–$7B (likely reflecting adjusted price units scaled by volume or some composite metric) with Tape B notional values concentrated between 105 and 127, forming a relatively dense central cloud. There are two prominent outliers on the far right of the X-axis: one near (17.9B, 100.01) and another near (12.5B, 100.61), both exhibiting very low Tape B notional values — these extreme observations exert disproportionate leverage on the regression line and likely correspond to specific high-volume trading days (possibly August 2015 market volatility events). A third cluster near (8.7B, 123.52) appears somewhat detached from the main body, suggesting possible regime shifts. Within the main cluster, the relationship is noisier than the aggregate correlation implies, with considerable vertical spread at any given X value — reinforcing the low R².
Confounding Factors and Interpretive Caveats
Several important caveats apply. First, the X-axis label and units warrant scrutiny: the column is described as "AAPL.Adjusted" from an OHLCV dataset, yet the values range into the billions — this likely represents a transformed, cumulative, or notional construct rather than a raw per-share price, which complicates direct interpretation. Second, both series are time-indexed through 2015, meaning shared exposure to macroeconomic events (the August 2015 flash crash, Federal Reserve rate speculation, Chinese market turbulence) could be driving co-movement rather than any direct causal link — a classic spurious correlation through common external shocks. Third, Tape B covers NYSE American and regional exchange-listed securities, so its notional volume is influenced by a broad universe of stocks, not just AAPL; attributing its variation to AAPL price alone is conceptually thin. Finally, with N = 506 total population points but only n = 222 paired observations, selection or alignment effects in how the datasets were joined could introduce bias.
Actionable Insights and Further Investigation
Given the moderate correlation, limited explanatory power, and absence of Granger causality, practitioners should avoid using AAPL price as a standalone predictor of Tape B notional volume. However, the relationship may be a useful component in a multi-factor model that also incorporates VIX (volatility index), overall S&P 500 index level, and broad market advance-decline ratios. Analysts should investigate whether the two extreme right-side outliers correspond to identifiable market events and consider whether excluding or separately modeling them changes the regression meaningfully — their removal would likely weaken the correlation. It would also be valuable to test non-linear specifications (e.g., log-log or piecewise regression), as the scatter suggests the relationship may behave differently at extreme X values versus the central cluster. Finally, extending the Granger causality test to longer lags (2–5 periods) and re-examining with a full N = 506 dataset could reveal delayed temporal dynamics not captured at the 1-period horizon.
X dataset: Cboe U.S. Equities Historical Market Volume Data 2015
Y dataset: S&P 500 Index Daily OHLCV (Date)
Part of experiment: Daily - Cboe U.S. Equities Historical Market Volume Data 2015 vs S&P 500 Index Daily OHLCV (Date)