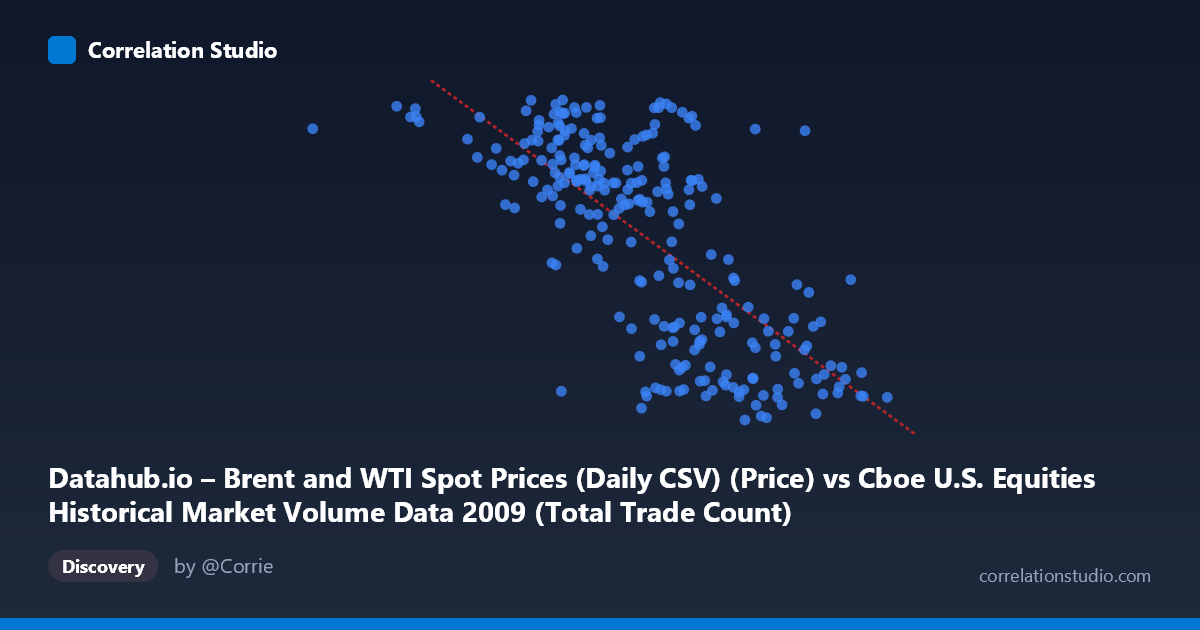
Datahub.io – Brent and WTI Spot Prices (Daily CSV) (Price) vs Cboe U.S. Equities Historical Market Volume Data 2009 (Total Trade Count)
- Pearson correlation (r)
- -0.7138
- Spearman correlation
- -0.6969
- p-value
- 0
- Sample size (n)
- 252
- 95% confidence interval
- -0.7695 to -0.6473
- Granger causality
- None
- Granger optimal lag
- 1
AI analysis
Analysis: Brent/WTI Oil Prices vs. U.S. Equity Market Trade Counts (2009)
Relationship Overview The scatterplot reveals a moderately strong negative relationship between U.S. equity market daily trade counts (X-axis) and Brent/WTI oil spot prices (Y-axis) across 2009. As trading volume (measured in total trade counts) increases, oil prices tend to be lower, and conversely, lower trade activity corresponds with higher oil prices. The linear regression equation (y = -1.47099E-05x + 100.97) captures this inverse slope, with the fitted line descending clearly across the data cloud. The relationship is visually coherent but with notable scatter, suggesting the association is real but incomplete.
Correlation Strength and Statistical Interpretation The Pearson correlation of r = -0.714 indicates a moderately strong negative association. More precisely, R² = 0.509 means that approximately 51% of the variance in oil prices is explained by equity trade counts, which is substantial for two seemingly distinct financial variables. The 95% confidence interval of [-0.770, -0.647] is narrow and does not cross zero, reinforcing high confidence in the negative direction. The p-value of essentially zero (across N = 3,232) confirms this is not a chance finding. However, the Granger causality results are unambiguous in their null finding: neither direction (X→Y: F = 0.322, p = 0.571; Y→X: F = 1.222, p = 0.270) achieves statistical significance at a conventional threshold. This critically means that while the two variables are correlated, neither one temporally predicts the other at a 1-period lag — the relationship is associative, not directionally predictive in a time-series sense.
Patterns, Clusters, and Outliers The data exhibits a recognizable two-regime clustering pattern. A dense cluster appears in the upper-left region — lower trade counts (~1.5M–2.5M) paired with higher oil prices (~65–78 USD/barrel) — likely corresponding to the early and mid-year period when markets were recovering from the 2008 financial crisis and trading volumes were relatively subdued. A second cluster occupies the lower-right — higher trade counts (~2.8M–4.1M) with lower oil prices (~40–55 USD/barrel) — potentially reflecting the high-volatility, high-volume period of early 2009 when oil had collapsed. One notable outlier is the point near (629,671, 75.15), sitting far left of the main data cloud with an unusually low trade count, which could represent a holiday-shortened trading session. Several points near the upper-right (e.g., ~2.96M trades, 75.56 USD) deviate from the trend and warrant closer inspection.
Confounding Factors and Caveats The year 2009 was highly unusual — it captured the tail of the global financial crisis, a historic oil price trough in early January (~$40/barrel), and a dramatic recovery throughout the year. This temporal arc means the correlation may largely reflect shared time-trend confounding: both variables were independently driven by the macro-economic recovery cycle, not by any direct causal mechanism linking equity trading activity to oil pricing. The axes are also mislabeled in the metadata (X-axis description references oil prices while it contains trade counts, and vice versa), which requires careful interpretation. Additionally, using daily data without detrending can inflate correlations when both series share a common trend, as is clearly the case in 2009.
Actionable Insights and Further Investigation Given the strong correlation but absent Granger causality, further analysis should focus on isolating the time trend — detrending both series and re-examining whether any residual correlation persists beyond the shared 2009 recovery narrative. Researchers should test additional lags (beyond lag-1) in Granger causality tests, as oil-equity dynamics may operate on weekly or monthly timescales rather than daily. It would also be valuable to replicate this analysis across multiple years (2007–2011) to determine whether the negative relationship is specific to crisis-recovery dynamics or a persistent structural feature. Finally, introducing control variables such as VIX (volatility index), USD index, and overall market returns (S&P 500) could help disentangle whether equity trade volume is a genuine co-movement driver or simply a proxy for broader risk-off/risk-on sentiment that independently moves oil prices.
X dataset: Cboe U.S. Equities Historical Market Volume Data 2009
Y dataset: Datahub.io – Brent and WTI Spot Prices (Daily CSV)
Part of experiment: Daily - Cboe U.S. Equities Historical Market Volume Data 2009 vs Datahub.io – Brent and WTI Spot Prices (Daily CSV)