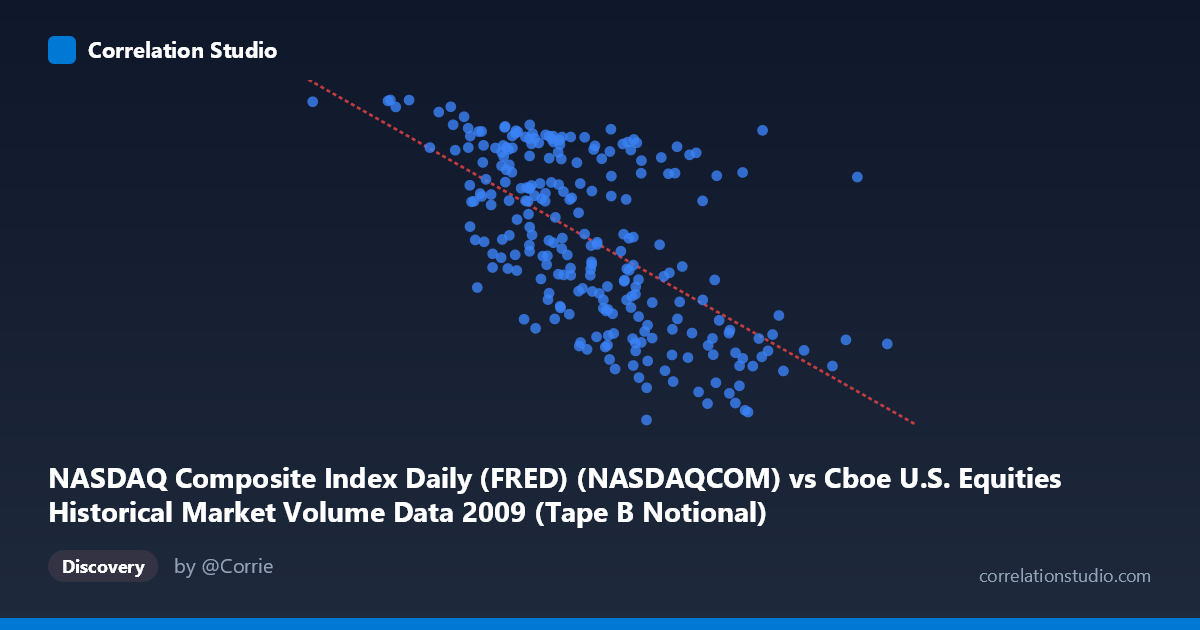
NASDAQ Composite Index Daily (FRED) (NASDAQCOM) vs Cboe U.S. Equities Historical Market Volume Data 2009 (Tape B Notional)
- Pearson correlation (r)
- -0.6169
- Spearman correlation
- -0.62
- p-value
- 0
- Sample size (n)
- 252
- 95% confidence interval
- -0.688 to -0.534
- Granger causality
- Bidirectional
- Granger optimal lag
- 10
AI analysis
Analysis: NASDAQ Composite Index vs. Cboe Tape B Notional Volume (2009)
Relationship Overview
The scatterplot reveals a negative relationship between the NASDAQ Composite Index daily closing values and Cboe U.S. Equities Tape B notional trading volume throughout 2009. As the NASDAQ index rose across the year — reflecting the market's recovery from the financial crisis lows — notional trading volume on Tape B venues tended to decline. This is visually consistent with the linear regression equation (y = -1.273×10⁻⁷x + 2516.93), where the negative slope confirms that higher index values are associated with lower notional volume. This pattern reflects a well-documented market dynamic: elevated trading volume often accompanies fear, uncertainty, and distress, which characterized early 2009, while calmer, rising markets tend to see reduced but more deliberate trading activity.
Correlation Strength and Statistical Significance
The Pearson correlation of r = -0.6169 indicates a moderately strong negative association, and the R² of 0.3806 means that approximately 38.1% of the variance in Tape B notional volume is explained by the NASDAQ index level alone — a meaningful but far from complete explanation, leaving roughly 62% attributable to other factors. The 95% confidence interval of [-0.688, -0.534] is relatively tight and does not cross zero, reinforcing confidence in the negative direction of the relationship. With a p-value effectively at 0 across a paired sample of n = 252 drawn from a population of N = 3,232, the result is highly statistically significant and unlikely to be a sampling artifact. The Granger causality analysis adds important nuance: bidirectional Granger causality is detected at a 10-period lag (X→Y: F = 1.88, p = 0.049; Y→X: F = 1.96, p = 0.039). Both directions are only marginally significant, suggesting a weak, mutually reinforcing feedback loop rather than a clear dominant causal pathway — index movements may partially predict future volume, and volume shifts may weakly predict future index direction, but neither relationship is robust enough to serve as a reliable standalone predictor.
Notable Patterns, Clusters, and Outliers
Several structural features are visible in the sample data. There is a notable cluster of high-volume, low-index observations at lower X values (roughly NASDAQ below 2,000), corresponding to the distressed early-2009 market environment. Conversely, as the index approaches the 7,000–9,500 range (mid-to-late 2009 recovery), Tape B notional values compress toward the 1,268–1,600 range. A few outliers are apparent: the point near (2,427,704,497; 2,291) and another near (1,320,771,983; 2,286) represent very high notional volume at relatively low index levels — potentially corresponding to the market's most volatile and distressed days in early 2009 (around March lows). At the upper end of the index range, some moderate-volume readings (e.g., ~2,194 at index ~7.73B) slightly deviate from the trend, suggesting heteroscedasticity — the variance in notional volume appears to decrease as the index rises, which may violate standard linear regression assumptions.
Confounding Factors and Interpretive Caveats
Several important caveats temper straightforward causal interpretation. First, 2009 is a structurally unique year: it encompasses the tail of the global financial crisis, a generational market bottom (March 2009), and a sharp V-shaped recovery — all driven by extraordinary macroeconomic events (TARP, Fed intervention, stimulus) that simultaneously affected both index levels and trading volumes. The correlation observed may be largely regime-specific and not generalizable to other periods. Second, Tape B notional volume specifically reflects trading on regional exchanges (now Cboe/BATS-affiliated venues), and its dynamics may differ from total market volume — structural market share shifts during 2009 as electronic trading grew could independently suppress or amplify Tape B figures irrespective of index performance. Third, the bidirectional Granger causality at marginal significance levels (both p-values just below 0.05) warrants caution; with a lag of 10 periods and multiple tests, these results may reflect spurious temporal autocorrelation rather than true predictive causality. Fourth, the R² of 38% confirms that the relationship, while real, is far from deterministic — volatility indices (VIX), investor sentiment, options expiration cycles, and macroeconomic data releases likely explain substantial portions of the remaining variance.
Actionable Insights and Further Investigation
For practitioners and researchers, several directions merit follow-up. Regime-segmented analysis — splitting the dataset at the March 2009 market bottom — would clarify whether the negative correlation holds symmetrically during the crash phase versus the recovery phase, or whether the relationship is asymmetric. Incorporating VIX or realized volatility as a covariate could significantly improve explanatory power beyond the current 38%, since fear-driven volume spikes are likely a primary mechanism behind this relationship. Given the marginal Granger causality results, expanding the lag structure analysis (testing 1–20 periods) and applying vector autoregression (VAR) modeling would provide a more rigorous test of temporal predictive relationships. Finally, replicating this analysis across multiple years (2007–2010) would help distinguish whether this negative volume-index relationship is a persistent structural feature of U.S. equity markets or an artifact of the extraordinary conditions of 2009 — a distinction with significant implications for market microstructure research and trading strategy development.
X dataset: Cboe U.S. Equities Historical Market Volume Data 2009
Y dataset: NASDAQ Composite Index Daily (FRED)
Part of experiment: Daily - Cboe U.S. Equities Historical Market Volume Data 2009 vs NASDAQ Composite Index Daily (FRED)