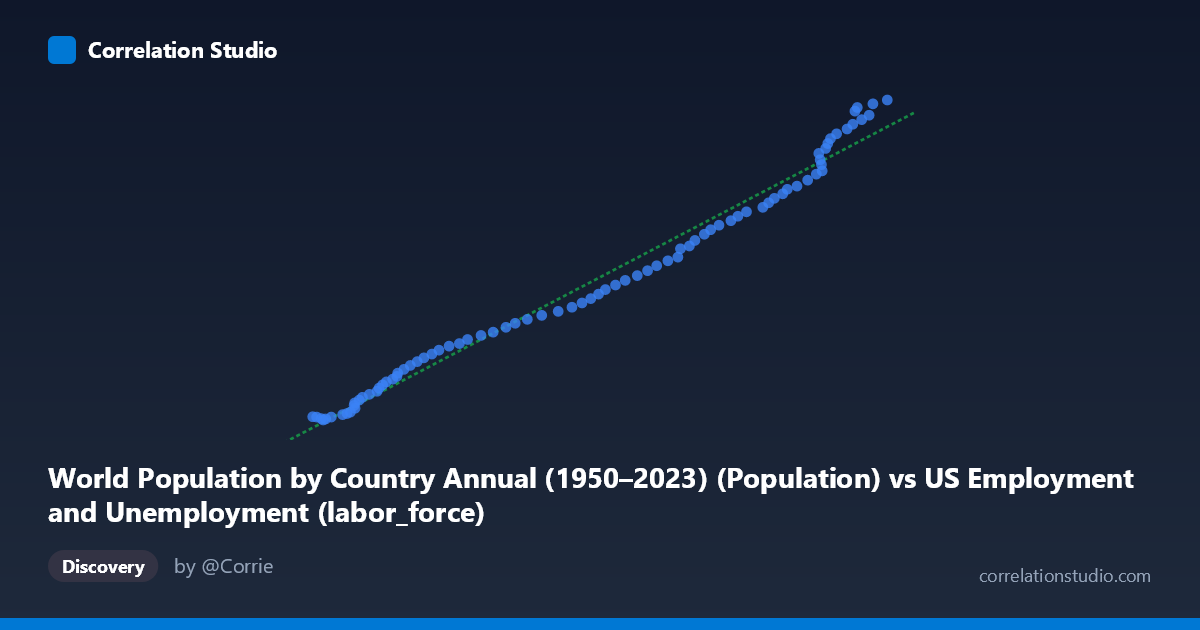
World Population by Country Annual (1950–2023) (Population) vs US Employment and Unemployment (labor_force)
- Pearson correlation (r)
- 0.9911
- Spearman correlation
- 0.9991
- p-value
- 0
- Sample size (n)
- 83
- 95% confidence interval
- 0.9863 to 0.9943
- Granger causality
- None
- Granger optimal lag
- 10
AI analysis
Scatterplot Analysis: World Population vs. US Labor Force (1941–2023)
1. Overall Relationship The scatterplot reveals a strikingly tight, positive linear relationship between world population and the US labor force over the observed period. As global population rises, the US labor force grows in near-lockstep, with data points clustering very closely along the regression line (y = 969.80x − 8,634,500). This visual impression of near-perfect alignment is consistent with what one would expect when two variables share a common underlying driver — in this case, the passage of time itself driving both demographic and labor market expansion simultaneously across eight decades.
2. Correlation Strength and Statistical Framing The Pearson correlation of r = 0.9911 is exceptionally high, and the R² of 0.9824 means that approximately 98.2% of the variance in the US labor force is statistically "explained" by world population within this linear model. The 95% confidence interval [0.9863, 0.9943] is narrow, indicating high precision in the estimate, and the p-value of effectively zero confirms the result is not attributable to chance. However, the Granger causality analysis critically undermines any causal interpretation: neither direction (X→Y: F=1.43, p=0.193; Y→X: F=1.53, p=0.156) achieves statistical significance at conventional thresholds, even at an optimal lag of 10 periods. This means world population does not temporally predict the US labor force (or vice versa) beyond what each series predicts from its own history — a strong signal that the correlation is associative, not directional.
3. Patterns, Clusters, and Outliers The data form a remarkably continuous, nearly linear arc from the lower-left (smaller populations, smaller labor forces in the early mid-20th century) to the upper-right (larger values in recent decades). There is a slight visual suggestion of mild curvature or heteroscedasticity at the upper end of the distribution, where several points (e.g., near X≈160,000–167,000; Y≈154M–163M) appear to deviate slightly more from the line, potentially reflecting post-2000 labor force participation rate declines in the US that partially decoupled the two trends. No dramatic outliers are present, though a handful of lower-range points (e.g., X≈53,860–55,910) show modest scatter, possibly reflecting wartime labor force disruptions in the 1940s.
4. Confounding Factors and Caveats This correlation is a classic spurious correlation driven by shared temporal trend. Both world population and the US labor force grow monotonically over time; any two such trending variables will correlate strongly regardless of any real-world mechanism connecting them. Additional confounders include: US domestic birth rate and immigration policy (true drivers of labor force growth), post-WWII Baby Boom dynamics, changes in female labor force participation, evolving BLS measurement methodology, and the exclusion of non-civilian workers. The dataset mismatch in labeling — population data attributed to "US Employment" and labor force data attributed to "World Population" — also warrants scrutiny and data provenance verification before drawing conclusions.
5. Actionable Insights and Further Investigation Given the lack of Granger causality, this relationship should not be used for predictive modeling of one variable from the other. Recommended next steps include: (a) detrending both series (e.g., via first-differencing or HP filter) to examine whether any residual correlation persists after removing shared time trends; (b) testing whether US population specifically (rather than world population) better explains labor force variation; (c) incorporating labor force participation rates as a dependent variable to isolate behavioral changes from pure demographic growth; and (d) applying structural break tests around key events (1970s stagflation, 2008 financial crisis, 2020 pandemic) to assess whether the linear relationship holds across different economic regimes.
X dataset: US Employment and Unemployment
Y dataset: World Population by Country Annual (1950–2023)
Part of experiment: Yearly - US Employment and Unemployment vs World Population by Country Annual (1950–2023)