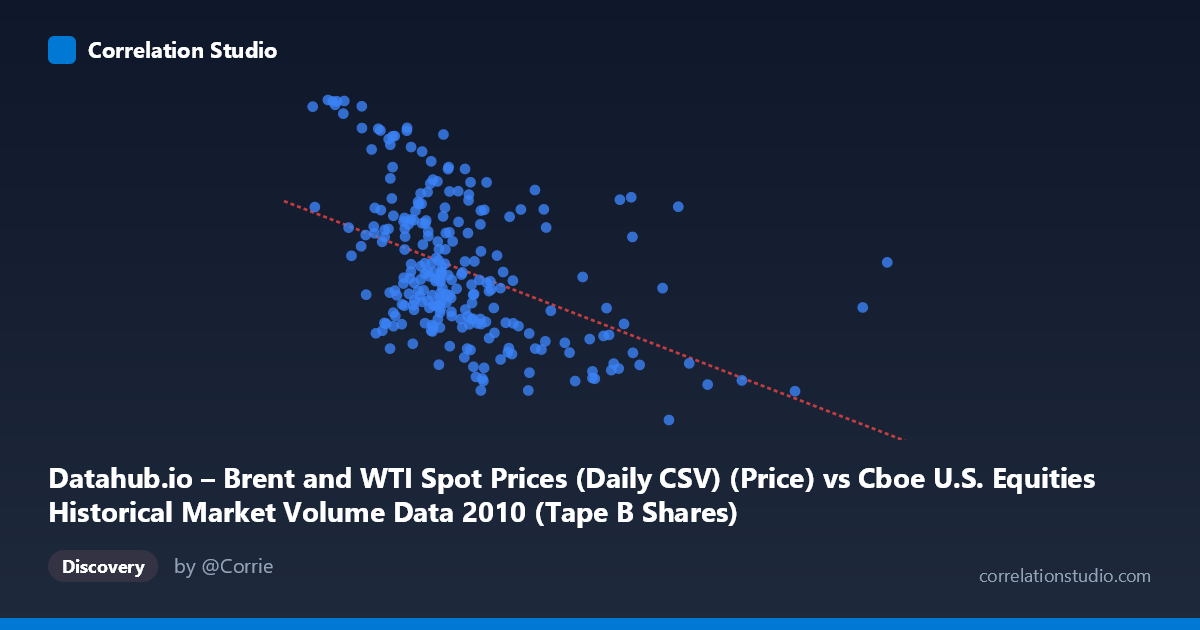
Datahub.io – Brent and WTI Spot Prices (Daily CSV) (Price) vs Cboe U.S. Equities Historical Market Volume Data 2010 (Tape B Shares)
- Pearson correlation (r)
- -0.4685
- Spearman correlation
- -0.4905
- p-value
- 0
- Sample size (n)
- 252
- 95% confidence interval
- -0.5597 to -0.3661
- Granger causality
- None
- Granger optimal lag
- 1
- Time coverage
- 2010-01-04 to 2010-12-31
- Recomputed on refreshed data
- 2026-10-22 (r was -0.4685)
AI analysis
Analysis: Brent Oil Prices vs. Cboe Tape B Share Volume (2010)
Relationship Overview The scatterplot reveals a moderate negative relationship between U.S. equity market volume (Tape B shares traded on Cboe exchanges) and Brent crude oil spot prices during 2010. As oil prices increased, Tape B share volumes tended to decline. The linear regression equation (y = -6.30×10⁻⁸x + 86.72) confirms this inverse slope, suggesting that for every roughly 15.9 million additional shares traded, Brent crude prices were associated with approximately one dollar per barrel decrease. The relationship is visually discernible but far from deterministic — the cloud of points shows considerable scatter around the regression line, consistent with a moderate rather than strong association.
Correlation Strength and Statistical Significance The Pearson correlation of r = -0.4685 indicates a moderate negative association. Critically, the R² of 0.2195 means only ~22% of the variance in Brent oil prices is explained by Tape B share volume, leaving roughly 78% attributable to other factors entirely. The 95% confidence interval of [-0.5597, -0.3661] is meaningfully narrow and does not cross zero, and the p-value of 3.78×10⁻¹⁵ confirms this is highly statistically significant — almost certainly not a chance finding given n = 252 paired observations from a population of 3,302 trading days. However, the Granger causality results are notably uninformative: neither direction shows significant temporal predictive power at conventional thresholds (X→Y: F = 0.81, p = 0.37; Y→X: F = 3.58, p = 0.060). The Y→X direction approaches significance, tentatively hinting that oil prices may weakly predict subsequent volume changes, but this falls short of the 0.05 threshold and should not be overstated.
Notable Patterns, Clusters, and Outliers Several features stand out in the data. There is a visible cluster of high-Y outliers (Brent prices above ~88–93 $/barrel) concentrated at relatively low X values (Tape B volumes below ~120 million shares), including notable points near (45M shares, 93.6) and (53M shares, 93.6). These high oil price observations appear to occur during periods of lower equity market activity. Conversely, high-volume trading days (X 180–320 million shares) are almost exclusively associated with lower Brent prices (roughly 67–77 $/barrel), suggesting that periods of elevated market turnover coincide with depressed energy prices. There is also a modest non-linear hint — the variance in Y appears to compress at higher X values — though the linear model captures the dominant trend adequately.
Confounding Factors and Caveats Several important caveats apply. First, this is an ecological/temporal correlation across a single calendar year (2010), a period that included the European sovereign debt crisis and the aftermath of the 2008–2009 financial crisis recovery — both of which independently drove both market volume and oil prices. High equity trading volume in 2010 was often associated with risk-off episodes and market stress, which simultaneously suppressed commodity prices, making a common-cause explanation highly plausible. Second, the axis labeling appears inverted in the dataset metadata (X column is labeled as oil price data, Y as Cboe volume data), which warrants verification before drawing directional conclusions. Third, Tape B specifically covers NYSE American and regional exchange listings — a subset of total market activity — which may not fully represent broader market conditions. The Granger non-causality result reinforces that this correlation likely reflects shared macroeconomic drivers rather than any direct mechanism between trading volume and oil prices.
Actionable Insights and Further Investigation Despite the caveats, the ~22% explained variance is non-trivial and worth exploring further. Analysts should consider: (1) controlling for macroeconomic regime variables such as VIX (market fear index), S&P 500 returns, and USD index to test whether the correlation survives after accounting for common drivers; (2) extending the time series beyond 2010 to determine whether this relationship is stable across different market cycles or is an artifact of the specific macro environment; (3) examining lag structures more carefully — the borderline Granger result (Y→X, p = 0.060) suggests a potential 1-day predictive signal from oil prices to equity volume that could be explored with longer lag windows; and (4) decomposing Tape B volume into buy- vs. sell-initiated transactions to investigate whether the directional nature of trading activity carries additional explanatory power. The relationship is statistically real but mechanistically ambiguous, making confound-controlled multivariate modeling the logical next step.
X dataset: Cboe U.S. Equities Historical Market Volume Data 2010
Y dataset: Datahub.io – Brent and WTI Spot Prices (Daily CSV)
Part of experiment: Daily - Cboe U.S. Equities Historical Market Volume Data 2010 vs Datahub.io – Brent and WTI Spot Prices (Daily CSV)