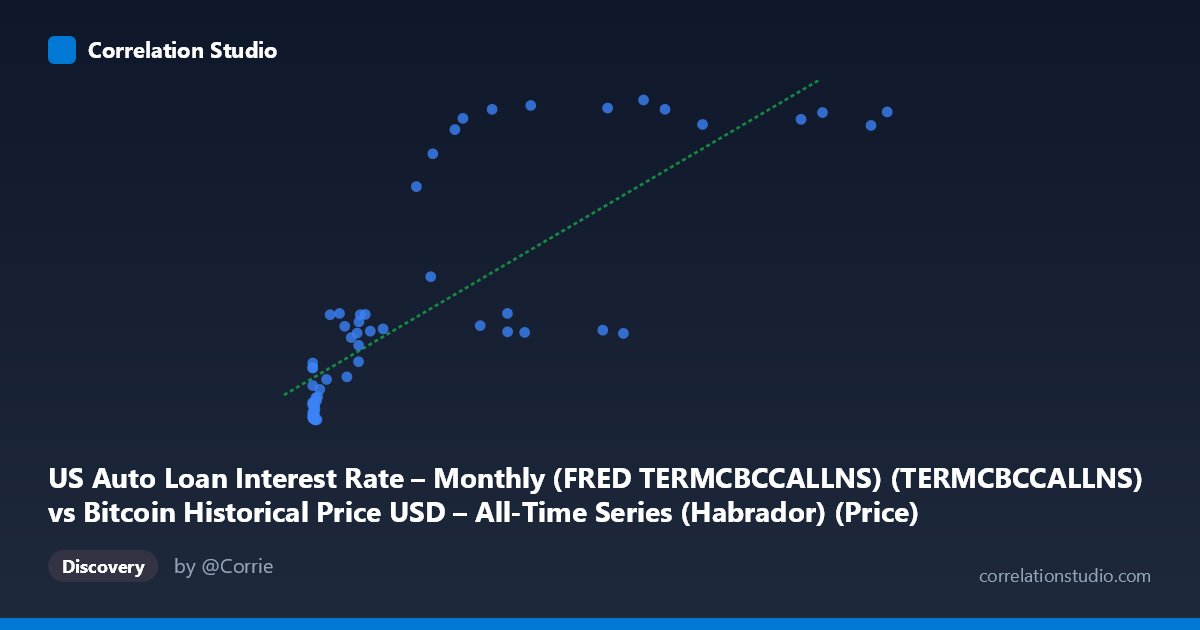
US Auto Loan Interest Rate – Monthly (FRED TERMCBCCALLNS) (TERMCBCCALLNS) vs Bitcoin Historical Price USD – All-Time Series (Habrador) (Price)
- Pearson correlation (r)
- 0.8081
- Spearman correlation
- 0.8199
- p-value
- 0
- Sample size (n)
- 63
- 95% confidence interval
- 0.7006 to 0.8797
- Granger causality
- None
- Granger optimal lag
- 1
- Time coverage
- 2010-08-01 to 2026-02-01
- Recomputed on refreshed data
- 2026-10-16 (r was 0.8081)
AI analysis
Analysis: Bitcoin Price vs. US Auto Loan Interest Rate
1. What the Visualization Reveals
This scatterplot pairs Bitcoin's historical USD price against the US Auto Loan Interest Rate (TERMCBCCALLNS), spanning 2010–2026. The data shows a clear positive, non-linear relationship: as Bitcoin's price rises through its characteristic exponential growth phases, the auto loan rate—which itself has been rising over the same period—tracks upward in tandem. The pattern is stepped rather than smoothly linear, with clusters of points at low Bitcoin prices (X < 1,000) corresponding tightly to rates in the 11.8–12.5% band, and a second cluster at high Bitcoin prices (X 60,000) corresponding to rates around 21–22%. There's a visible "jump" between these two regimes, with fewer points bridging the middle range.
2. Strength, Direction, and Statistical Interpretation
The correlation coefficient (r = 0.808) indicates a strong positive linear association, with r² = 0.653 meaning roughly 65% of the variance in one variable is statistically explainable by the other—though this is largely an artifact of both series moving upward over the same calendar period rather than direct interaction. The 95% CI [0.70, 0.88] is reasonably tight, and the p-value (1.11E-15) confirms this correlation is highly unlikely to be due to chance in this sample. However, the Granger causality tests are decisive here: neither direction shows significance (X→Y: p=0.93; Y→X: p=0.96), meaning neither variable helps predict the other's future values once past values of each are accounted for. This is the critical finding—strong contemporaneous correlation coexists with zero predictive/temporal causality.
3. Notable Patterns and Outliers
The data shows distinct clustering rather than a continuous cloud: a dense low-X/low-Y group (Bitcoin under ~$1,500, rates ~11.8–13.6%) and a high-X/high-Y group (Bitcoin above $60,000, rates ~21–22%), consistent with Bitcoin's historical price regimes (early years vs. 2021+ bull markets). A few points break the pattern—for example, (23723.77, 20.09) and (20485.27, 19.07) show high rates at moderate Bitcoin prices, suggesting the rate variable jumped or plateaued independent of Bitcoin's price trajectory at that time. This stepped, regime-like structure (rather than smooth linear scaling) is why a simple linear fit only captures 65% of variance despite visually strong grouping.
4. Confounding Factors and Caveats
This is a textbook case of spurious correlation via a shared confound: time/trend. Both Bitcoin price and auto loan rates have trended upward over 2010–2026 for entirely unrelated macroeconomic reasons—Bitcoin due to adoption/speculation cycles, auto loan rates due to Federal Reserve monetary policy tightening (especially post-2022). Neither variable plausibly causes the other economically; auto loan rates are driven by the Fed funds rate, bank lending conditions, and credit markets, while Bitcoin's price is driven by speculative demand, liquidity, and crypto-specific cycles. The Granger causality results support this interpretation—the correlation is a byproduct of both series co-trending with time, not a genuine bidirectional or unidirectional relationship. Additionally, comparing a monthly macro rate (bounded, slow-moving) against a highly volatile, exponentially-distributed asset price is a scale/distribution mismatch that inflates apparent linear fit statistics.
5. Actionable Insights
Treat this correlation as non-causal and non-predictive—it should not be used for trading, forecasting, or policy decisions linking auto lending conditions to crypto markets. A more rigorous approach would detrend both series (e.g., using differences or year-over-year % changes) or run the correlation on residuals after removing the shared time trend, which would likely collapse this relationship toward zero. Further investigation should focus on genuine macro drivers of Bitcoin (e.g., real interest rates, M2 money supply, risk appetite indices) rather than an incidental co-movement with consumer auto financing costs. If auto lending analysis is the goal, better predictors would include the Fed funds rate, credit spreads, or consumer credit indices rather than Bitcoin price.
X dataset: Bitcoin Historical Price USD – All-Time Series (Habrador)
Y dataset: US Auto Loan Interest Rate – Monthly (FRED TERMCBCCALLNS)
Part of experiment: Bitcoin - Bitcoin Historical Price USD – All-Time Series (Habrador) vs US Auto Loan Interest Rate – Monthly (FRED TERMCBCCALLNS)