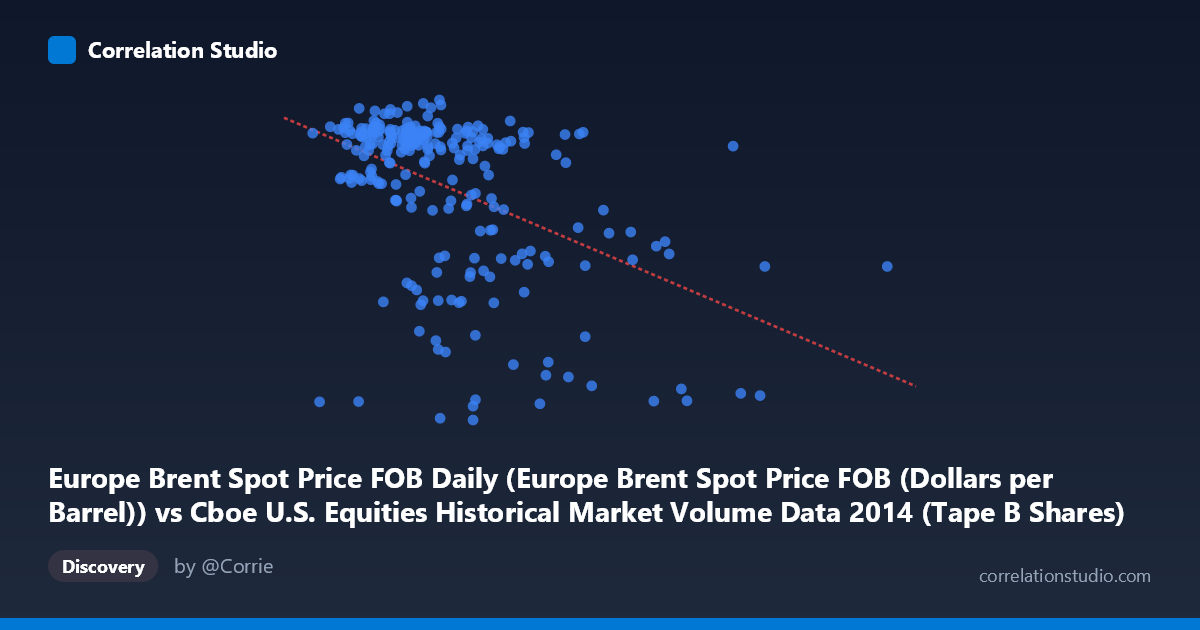
Europe Brent Spot Price FOB Daily (Europe Brent Spot Price FOB (Dollars per Barrel)) vs Cboe U.S. Equities Historical Market Volume Data 2014 (Tape B Shares)
- Pearson correlation (r)
- -0.4627
- Spearman correlation
- -0.4186
- p-value
- 0
- Sample size (n)
- 252
- 95% confidence interval
- -0.5545 to -0.3596
- Granger causality
- None
- Granger optimal lag
- 2
AI analysis
Analysis: Europe Brent Spot Price vs. Cboe Tape B Shares (2014)
Relationship Overview The scatterplot reveals a moderate negative relationship between Europe Brent crude oil spot prices (X-axis) and Cboe Tape B share volume (Y-axis) across 252 trading days in 2014. As oil prices increase, Tape B equity share volume tends to decrease, and conversely, lower oil prices are associated with higher trading volumes. The linear regression equation (y = -2.897×10⁻⁷x + 120.689) confirms this inverse trend, though the scatter around the regression line is considerable, suggesting the relationship is real but imprecise. Notably, the data appears to cluster in two broad regions — a dense band of high-volume activity concentrated at lower X values, and a more dispersed grouping at higher oil price levels with generally lower volumes.
Correlation Strength and Statistical Significance The Pearson correlation of r = -0.4627 indicates a moderate negative association, but the variance explained metric provides important context: R² = 0.2141, meaning Brent crude prices account for only about 21.4% of the variance in Tape B share volume, leaving nearly 79% explained by other factors. The 95% confidence interval of [-0.5545, -0.3596] is entirely negative and does not cross zero, reinforcing the directional reliability of this estimate. The p-value of 9.1×10⁻¹⁵ is extraordinarily small, confirming the correlation is highly statistically significant given the sample of 252 paired observations drawn from a population of 3,686. However, statistical significance here reflects the robustness of detecting some association rather than implying a strong or practically dominant relationship. Crucially, Granger causality analysis finds no significant predictive direction in either direction — neither X→Y (F=1.92, p=0.149) nor Y→X (F=0.42, p=0.657) — meaning that past values of oil prices do not reliably predict future Tape B volumes, and vice versa. This effectively rules out a straightforward temporal causal mechanism between the two series.
Patterns, Clusters, and Outliers Several structural features stand out. There is a visually prominent dense cluster in the upper-left region of the plot (oil prices roughly $55–$90/barrel, Tape B shares ~100–115 billion), corresponding likely to the first half of 2014 when oil prices were elevated and equity volumes were relatively active. A second, more dispersed grouping appears in the lower-right (oil prices $90–$165/barrel, Tape B shares ~55–95 billion), consistent with the well-documented oil price decline in late 2014. Several outliers are apparent: notably, points with very low Tape B values (~55–60) at both moderate and high oil price levels (e.g., ~73M and ~155M on the X-axis), which may represent specific market disruption days or holiday-adjacent low-volume sessions. The point near (73,342,206, 55.60) is particularly anomalous given the otherwise dense clustering of neighboring X values near 110+ on the Y-axis, suggesting a possible data anomaly or extraordinary market event worth flagging.
Confounding Factors and Caveats Several important caveats temper interpretation. First, 2014 was an extraordinary year for oil markets, with Brent crude falling roughly from ~$115/barrel in June to ~$55/barrel by year-end — this secular downtrend creates a strong time-series confound where both variables are trending, potentially inflating the apparent correlation via shared temporal drift rather than genuine co-movement. Second, Tape B volume reflects trading in NYSE American-listed securities and regional exchange activity, which may respond more to broad market sentiment and volatility regimes than to oil prices specifically. Third, Granger causality's null result warns that the correlation may be largely spurious or mediated by a common third factor — such as macroeconomic uncertainty, Federal Reserve policy expectations, or broader risk-off sentiment — rather than a direct oil-equity volume link. Finally, the dataset mixes daily frequencies from two fundamentally different markets (commodity spot vs. equity microstructure), and microstructure effects like end-of-quarter rebalancing or holiday-period low volume could distort apparent patterns.
Actionable Insights and Further Investigation Despite the moderate and non-causal nature of this relationship, several avenues warrant further exploration. Regime segmentation — splitting the data into pre- and post-oil-price-decline periods (e.g., before and after June/July 2014) — could reveal whether the correlation is driven entirely by the second-half crash or persists across stable price environments. Investigators should examine the identified outliers (particularly the anomalously low Tape B days) to determine if they represent data quality issues or genuine market events such as circuit breakers or early market closures. Incorporating VIX or equity market volatility as a control variable would help isolate whether the observed relationship is mediated by risk sentiment rather than oil prices per se. Finally, extending the analysis to multiple years with varying oil price regimes, or comparing Tape B with Tape A and Tape C volumes, would clarify whether this correlation is structurally stable or an artifact of 2014's unique commodity market dynamics.
X dataset: Cboe U.S. Equities Historical Market Volume Data 2014
Y dataset: Europe Brent Spot Price FOB Daily
Part of experiment: Daily - Cboe U.S. Equities Historical Market Volume Data 2014 vs Europe Brent Spot Price FOB Daily