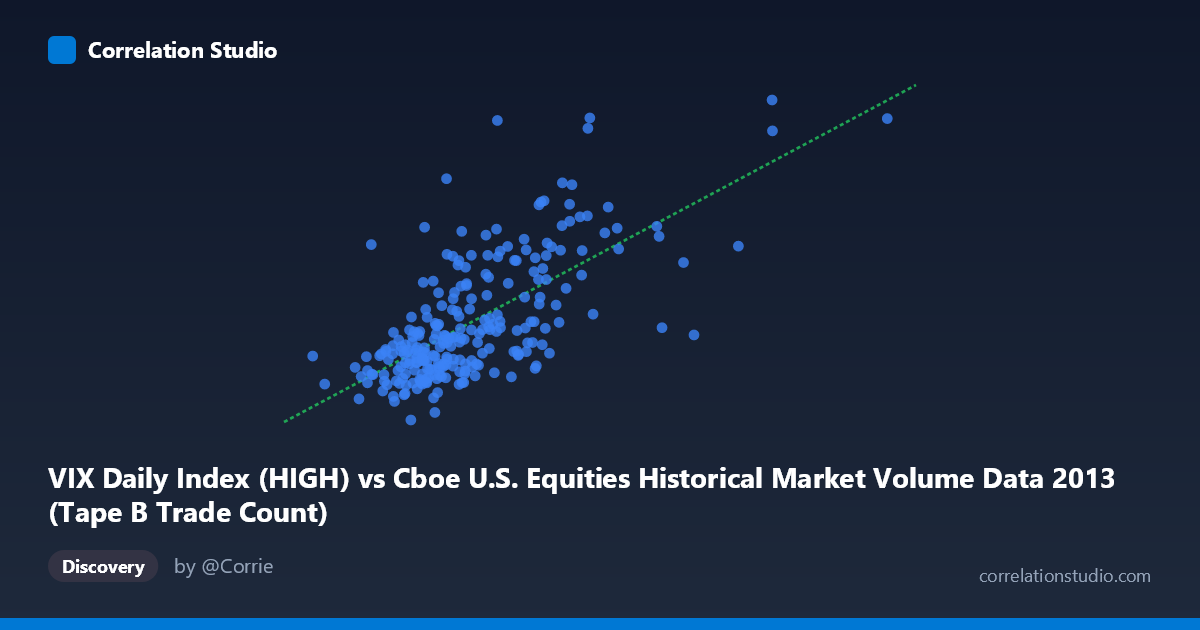
VIX Daily Index (HIGH) vs Cboe U.S. Equities Historical Market Volume Data 2013 (Tape B Trade Count)
- Pearson correlation (r)
- 0.6825
- Spearman correlation
- 0.6518
- p-value
- 0
- Sample size (n)
- 252
- 95% confidence interval
- 0.6104 to 0.7433
- Granger causality
- None
- Granger optimal lag
- 1
AI analysis
Scatterplot Analysis: VIX High vs. Tape B Trade Count (2013)
Relationship Overview The scatterplot reveals a moderate-to-strong positive relationship between the VIX Daily Index High values and Cboe U.S. Equities Tape B Trade Count throughout 2013. As the VIX High increases, Tape B trade counts tend to rise correspondingly, which aligns intuitively with market behavior: elevated volatility typically drives higher trading activity as market participants react to uncertainty by repositioning, hedging, or opportunistically trading. The linear regression equation (y = 2.96466E-05x + 9.684) confirms this upward trend, suggesting that for every unit increase in VIX High, trade counts increase by a small but consistent increment.
Correlation Strength and Statistical Significance The correlation coefficient of r = 0.6825 indicates a moderately strong positive association, and the r² of 0.4658 means that roughly 46.6% of the variance in Tape B Trade Count is statistically explained by VIX High values — a meaningful but incomplete picture, leaving over half the variance attributable to other factors. The 95% confidence interval of [0.6104, 0.7433] is relatively narrow given the sample size of n = 252 drawn from a population of N = 3,780, and the p-value of effectively zero confirms this relationship is highly unlikely to be a chance finding. However, despite this statistical robustness, the Granger causality results are notably absent in both directions — X→Y (F = 0.074, p = 0.786) and Y→X (F = 0.0001, p = 0.994) — indicating that neither variable temporally predicts the other with a one-period lag. This is a critical nuance: the two variables move together, but neither demonstrably leads the other, suggesting they respond simultaneously to common underlying drivers rather than one causing the other.
Notable Patterns, Clusters, and Outliers The data exhibits several visually distinct features. A dense central cluster sits in the range of approximately X = 130,000–200,000 and Y = 12.5–16.5, representing the majority of typical trading days in 2013 when volatility was moderate and trade counts were correspondingly contained. Above this core, a secondary dispersed cluster emerges at higher VIX values (X 200,000), where trade counts spread more widely, suggesting greater variability in market response during high-volatility regimes. Several notable outliers stand out, particularly points near (241,064, 21.01), (189,357, 21.26), and (327,004, 17.27) — the first two exhibiting unusually high VIX readings relative to their trade counts, and the last showing extremely high trade volume with a comparatively moderate VIX level. These outliers may correspond to specific market events (e.g., Fed announcements, geopolitical shocks) and warrant individual examination.
Confounding Factors and Interpretive Caveats Several important caveats temper straightforward interpretation. First, Tape B specifically covers NYSE American (AMEX)-listed securities, which represent a subset of the broader U.S. equity market, so the relationship may not generalize uniformly across all tapes or exchanges. Second, secular trends within 2013 — such as gradual market recovery and structural changes in electronic trading volumes — could be creating a spurious or inflated correlation if both variables share a common time trend rather than a direct causal link. Third, the VIX is itself a forward-looking implied volatility measure derived from options pricing, not a direct measure of realized market activity, creating a conceptual gap between the two variables. Fourth, algorithmic and high-frequency trading activity in Tape B could amplify trade counts independently of investor sentiment captured by the VIX. Finally, the lack of Granger causality at lag-1 suggests the relationship may operate at intraday frequencies not captured in this daily-aggregated dataset.
Actionable Insights and Further Investigation Despite the non-causal Granger result, the r² of ~47% makes VIX High a practically useful contemporaneous predictor of Tape B trading activity, relevant for exchange capacity planning, liquidity forecasting, and risk management frameworks. Practitioners could incorporate VIX thresholds as early-warning indicators for elevated trade volumes. For further investigation, it would be valuable to: (1) test multiple Granger lags beyond lag-1 to detect any delayed causality; (2) decompose the time series to remove trend components and retest the correlation on detrended residuals; (3) examine intraday data to determine if the relationship is more pronounced at shorter time scales; (4) compare against Tape A and Tape C to assess whether this pattern is Tape B-specific or market-wide; and (5) isolate the outlier dates to identify whether specific macro events disproportionately drive the observed relationship.
X dataset: Cboe U.S. Equities Historical Market Volume Data 2013
Y dataset: VIX Daily Index
Part of experiment: Daily - Cboe U.S. Equities Historical Market Volume Data 2013 vs VIX Daily Index