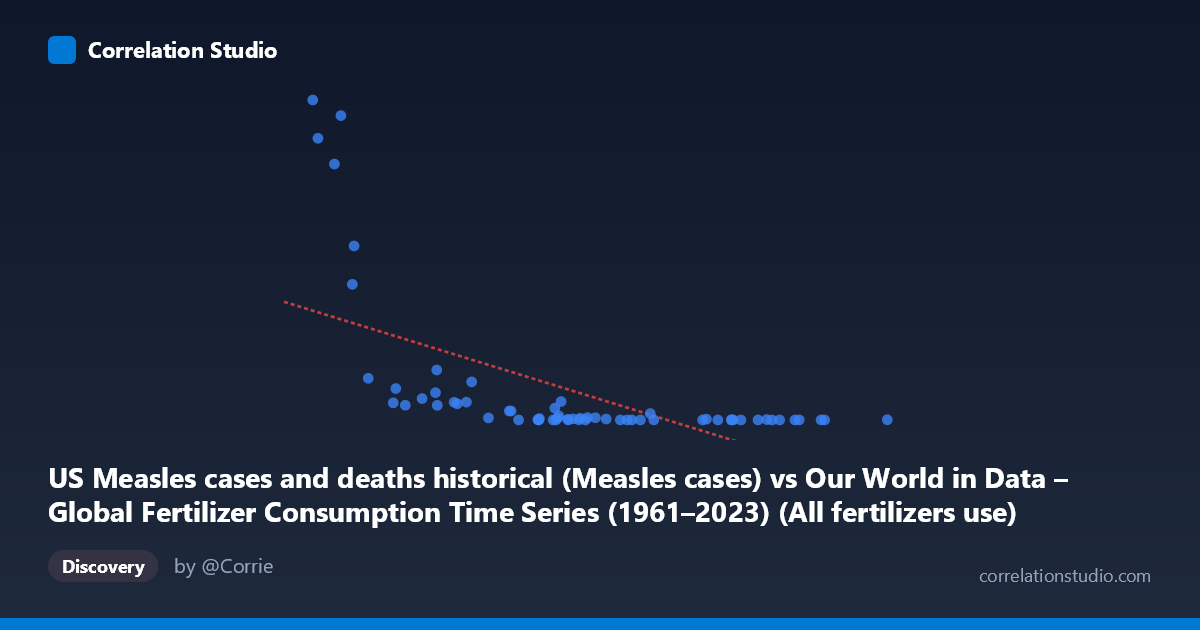
US Measles cases and deaths historical (Measles cases) vs Our World in Data – Global Fertilizer Consumption Time Series (1961–2023) (All fertilizers use)
- Pearson correlation (r)
- -0.5976
- Spearman correlation
- -0.7777
- p-value
- 0
- Sample size (n)
- 63
- 95% confidence interval
- -0.7364 to -0.4107
- Granger causality
- None
- Granger optimal lag
- 10
AI analysis
Scatterplot Analysis: US Measles Cases vs. Global Fertilizer Consumption (1961–2023)
1. What the Visualization Reveals
The scatterplot displays a negative relationship between US measles cases (X-axis) and global fertilizer consumption (Y-axis), plotted across annual observations from 1961 to 2023. The overall pattern shows that higher measles case counts tend to cluster at lower fertilizer consumption values, while higher fertilizer consumption values appear at lower measles case counts. However, this is not a tight, linear band — the data exhibits considerable scatter, with several high-leverage points in the upper-left region of the plot (low measles cases, very high fertilizer use) contrasting with a dense cluster of points at low values on both axes. The visual impression is less of a direct causal relationship and more of two variables independently trending over time: measles cases declined sharply after vaccination programs intensified in the 1960s–1980s, while fertilizer use climbed steadily across the same decades.
2. Correlation Strength, Direction, and Statistical Context
The Pearson correlation of r = -0.5976 indicates a moderate negative association, and the R² of 0.3572 means that approximately 35.7% of the variance in fertilizer consumption is statistically "explained" by measles cases — leaving nearly two-thirds of the variance unaccounted for by this linear model alone. The 95% confidence interval of [-0.7364, -0.4107] is moderately wide but does not cross zero, and the p-value of 2.327 × 10⁻⁷ confirms this correlation is highly statistically significant given n = 63 paired observations. That said, statistical significance here reflects the strength of a shared temporal trend, not a meaningful direct relationship. Crucially, the Granger causality analysis finds no significant predictive direction in either direction (X→Y: F = 1.96, p = 0.073; Y→X: F = 1.03, p = 0.439), meaning that past measles case counts do not help predict future fertilizer use, and vice versa. This effectively rules out any temporal predictive mechanism between these variables.
3. Notable Patterns, Clusters, and Outliers
Several structural features stand out. A dense cluster of points occupies the lower-right region of the plot — low fertilizer consumption paired with moderate-to-high measles cases — corresponding to the early 1960s before both widespread vaccination and the Green Revolution's fertilizer expansion. In contrast, the upper-left region contains striking high-leverage outliers: points with very low measles cases (near zero) but extremely high fertilizer consumption, representing recent decades when measles was nearly eliminated in the US. A handful of points with Y-values exceeding 200,000–460,000 (fertilizer consumption) paired with low measles counts are particularly influential on the regression line. The note that Spearman ρ exceeds Pearson r is diagnostically important — it signals that the true relationship is better described by a monotonic but non-linear function (likely logarithmic or power-law), meaning the linear regression line (y = -0.0136x + 207,527) may be systematically mischaracterizing the shape of the association at extreme values.
4. Confounding Factors and Interpretive Caveats
This correlation is almost certainly a classic spurious correlation driven by a shared time trend — both variables are strongly time-dependent. US measles cases declined precipitously following the introduction of the measles vaccine in 1963 and accelerated eradication efforts through the 1980s, while global fertilizer consumption rose steadily from the 1960s onward due to agricultural industrialization, population growth, and the Green Revolution — processes entirely unrelated to infectious disease control. Any apparent correlation is therefore a temporal confound: both series share a monotonic trend across the same 60-year window, which mechanically produces a negative correlation without any plausible causal mechanism. Additionally, the axis labels appear to be swapped relative to the dataset descriptions provided — fertilizer consumption is listed as the Y-axis from the measles dataset and vice versa, suggesting potential data pipeline misattribution that should be verified before drawing any conclusions.
5. Actionable Insights and Further Investigation
Given the near-certain spurious nature of this correlation, the most valuable next step would be to detrend both time series (e.g., via first-differencing or residualization against a time variable) before re-computing correlation — if the association disappears after detrending, that confirms it is purely a shared temporal artifact. Researchers should also fit a logarithmic or polynomial model given the Spearman Pearson signal, which may better capture the non-linear compression of measles cases toward zero post-vaccination. More broadly, this pairing serves as a useful pedagogical example of why correlation without causal mechanism and temporal control is misleading: two globally trending variables measured over the same era will almost always correlate, regardless of substantive connection. If the underlying goal is to study fertilizer consumption drivers, the analysis should incorporate agronomic, economic, and population variables; if the goal is measles dynamics, vaccination rates, healthcare access, and outbreak data are the appropriate covariates.
X dataset: Our World in Data – Global Fertilizer Consumption Time Series (1961–2023)
Y dataset: US Measles cases and deaths historical
Part of experiment: Yearly - Our World in Data – Global Fertilizer Consumption Time Series (1961–2023) vs US Measles cases and deaths historical